Assays and Tools to Monitor Biology in 3D Cell Cultures
- There are several important parameters to monitor when using 3D cell cultures: cell health, metabolism, live-cell protein dynamics, gene expression analysis, and genomic changes.
- Choose assays based on: 1) The biological question, 2) Lytic vs. Non-lytic, 3) Multiplexing needs, 4) Downstream applications.
- Non-lytic assays preserve 3D cultures for downstream analysis; lytic assays penetrate spheroids while lysing the cell.
- Same-well multiplexing maximizes data from limited 3D samples — combine viability + cytotoxicity + expression measurements.
- Many Promega assays work unmodified in 3D; some require protocol optimization for spheroid/organoid penetration.
Why Use 3D Cell Cultures?
Researchers are turning to 3D culture methods such as spheroids, organoids and organs-on-a-chip to create model systems for studying cellular biology. 3D cell culture mimics the tissue or tumor environment more closely than a 2D environment by facilitating more natural interactions with a matrix and even allowing cells to secrete their own matrix. 3D cell culture also offers more natural cell-to-cell contacts and produces a gradient of access to O₂ and nutrients.
Often, 3D cell culture can reveal dramatic differences in cellular responses compared to monolayer culture. Monitoring the biology of cells in 3D culture can be approached by looking at changes in cell health, metabolism and expression. Ultimately, these phenotypic changes are related back to the genotype of the cell or the alterations in the genotype that led to a disease state. We offer assays and tools to address each step in your workflow, from cell health and metabolic changes to gene expression and analysis.
New to 3D Cell Culture?
Learn about 3D cell cultures, why and how they are used, and how to choose assays for 3D models.
How Do I Monitor Cell Health in 3D Cell Cultures?
Cell health assays measure viability, cytotoxicity, and apoptosis. Most were designed for monolayer cultures, but 3D models require optimized protocols. The challenge: penetrating spheroid/organoid cores to release cellular markers for measurement. Promega offers both lytic assays (complete lysis, higher signal) and non-lytic assays (preserve cells for downstream analysis) optimized for 3D.
New to monitor biology in 3D Cell Culture?
When working with 3D culture models, choosing the right assay system is crucial. Learn about tools to monitor biology in 3D culture.
CellTiter-Glo® 3D Cell Viability Assay
Lytic Assay
Monitor cell viability through measurement of ATP with a reagent specifically designed for 3D cultures. Utilizes the same ATP measurement luciferase chemistry of the classic CellTiter-Glo® Assay with greater lytic power, which allows deeper penetration yielding greater ATP release for quantitation. Co-measure dead cells with same-well multiplexing with CellTox™ Green Cytotoxicity Assay or media sampling with the LDH-Glo™ Cytotoxicity Assay.

Drug Screening Using Single Organoids
Organoids provide an essential tool for more accurately predicting in vivo responses from drug screening campaigns as they are more representative of the cellular heterogeneity within human tissue. Despite the pressing need for such models in drug screening, adoption of organoid in vitro assays for HTS is still limited due to workflow challenges, including lack of reproducibility and scalability. Highlighted here, Cell Microsystems and Promega provide an automated solution for reproducibly generating hundreds of organoids ready for use in plate-based assays that have been optimized and validated for 3D cell culture models.

Viability of unsorted compared to sorted organoids.
CellTiter-Glo® 3D Cell Viability Assay
Lytic Assay
Monitor cell viability through measurement of ATP with a reagent specifically designed for 3D cultures. Utilizes the same ATP measurement luciferase chemistry of the classic CellTiter-Glo® Assay with greater lytic power, which allows deeper penetration yielding greater ATP release for quantitation. Co-measure dead cells with same-well multiplexing with CellTox™ Green Cytotoxicity Assay or media sampling with the LDH-Glo™ Cytotoxicity Assay.
Lytic Capacity of CellTiter-Glo® 3D Compared to ATPlite 1Step Reagent
RealTime-Glo™ MT Cell Viability Assay
Non-Lytic Assay
Monitor cell viability through a bioluminescent assay continuously for up to 72 hours. Extremely sensitive assay monitors cellular reducing equivalents. Isolate nucleic acid from the same well for gene expression or genome analysis. Multiplex with CellTox™ Green to also measure dead cells.
Response of RealTime-Glo™ MT Cell Viability Assay to Increasing HCT116 Spheroid Diameter

Details in Application Note (link below).
CellTox™ Green Cytotoxicity Assay
Non-Lytic Assay
Monitor cytotoxicity through a fluorescent assay continuously for 72 hours. Cell impermeable DNA binding dye enters cells with damaged membranes and stains cellular DNA. Multiplex with RealTime- Glo™ MT for continuous monitoring of live and dead cells or use upstream of CellTiter-Glo® 3D end-point analysis.
Same Well Multiplexing to Monitor Live and Dead Cells

Details in Scientific Poster (link below).
LDH-Glo™ Cytotoxicity Assay
Non-Lytic Assay
Measure cytotoxicity through lactate dehydrogenase release with this sensitive bioluminescent assay. The assay requires only 2–5μl of culture media per time point allowing multiple samplings from the same well. Use to measure cytotoxicity prior to other cellular assays like CellTiter- Glo® 3D or Caspase-Glo® 3/7 Assay.
Multiplexing the LDH-Glo™ Assay and the CellTiter-Glo® Assay

Human liver microtissue spheroids were treated with aflatoxin B1 for 48 hours. Media samples were collected and assayed with the LDH-Glo™ Assay. The remaining cells were assayed for viability with the CellTiter-Glo® 3D Assay. Details available in Technical Manual TM548.
Caspase-Glo® 3/7 3D Assay
Lytic Assay
Monitor apoptosis using a sensitive bioluminescent assay that measures caspase-3 and -7 activities. Multiplex with cytotoxicity and cell viability assays for a more complete characterization of the apoptotic response.
Multiplexing the CellTox™ Green Cytotoxicity Assay, CellTiter-Fluor™ Cell Viability Assay and Caspase-Glo® 3/7 3D Assay

Same-well multiplexing on A549 spheroids after a 24-hour exposure to bortezomib. Fluorescence and luminescence were measured using the GloMax® Discover Instrument.
RealTime-Glo™ Annexin V Apoptosis and Necrosis Assay
Non-Lytic Assay
Monitor apoptosis and secondary necrosis through a multiplexed bioluminescent annexin V assay and a fluorescent necrosis assay continuously for up to 48 hours. Isolate nucleic acid from the same well for gene expression or genome analysis.
Measurement of Annexin V Exposure and Secondary Necrosis of HepG2 Spheroids

Measurement of annexin V exposure and secondary necrosis of HepG2 spheroids to 48 hour exposure to paclitaxel using the RealTime-Glo™ Annexin V Apoptosis and Necrosis Assay. Luminescence and fluorescence measured with the GloMax® Discover Instrument.
P450‐Glo™ Assays
Non-Lytic Assay Option
Monitor activation of cytochrome P450 enzymes (CYP3A4, CYP1A2 and CYP2C9) through a bioluminescent assay. Non-lytic protocol option uses same protocol for monolayer and 3D cultures where prosubstrates diffuse into cells, get converted to luciferin through CYP activity and luciferin diffuses out for assay on culture media. Cells remain usable for other assays or nucleic acid extraction.
Monitoring Human Liver Microtissue CYP3A4 Activity and Viability

Monitoring human liver microtissue Cytochrome P450 3A4 activity and viability in response to rifampicin. CYP3A4 activity was measured using non-lytic P450-Glo™ 3A4 Assay with Luciferin-IPA followed by same-well measurement of viability with the CellTiter- Glo® 3D Assay. Measured with a GloMax® Discover Instrument.
Autophagy LC3 HiBiT Reporter Assay System
Non-Lytic Assay
Monitor autophagic LC3-II flux with a bioluminescent plate-based assay. Stably transfect cells with the LC3 HiBiT Reporter, grow in 3D culture and monitor using the Lytic HiBiT detection System. Reporter also allows monitoring of LC3-II protein through fluorescent microscopy.
Response of LC3 HiBiT Reporter- Expressing HEK293 Spheroids to Autophagy Stimulators and Inhibitors

Details in Scientific Poster (link below).
RealTime-Glo™ Extracellular ATP Assay
Non-Lytic Assay
The RealTime-Glo™ Extracellular ATP Assay is a bioluminescent assay designed for kinetic monitoring of ATP release from dying, stressed or activated cells. Extracellular ATP can function as a damage associated molecular pattern (DAMP) and is a key biomarker for determining whether a treatment induces immunogenic cell death,.
ATP Release from HCT-116 Spheroids Treated with Staurosporine.
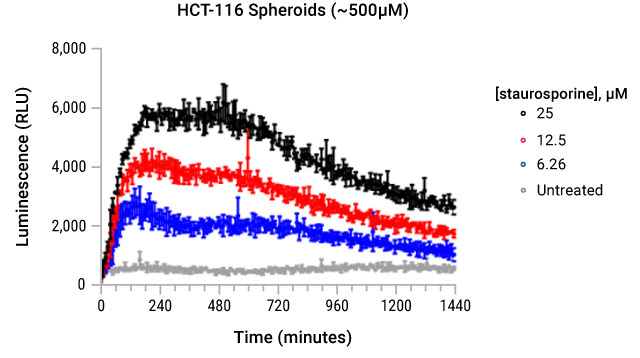
ATP release was monitored with the RealTime-Glo™ Extracellular ATP Assay and measured every 10 minutes over a 24 hour period.
Lumit® Cell Proliferation Assay (Human Ki-67)
Lytic Assay
Track hKi-67, a well-known marker of cell proliferation, with this add-and-read plate-based assay, without complicated washing steps and at earlier time points. The kit includes CellTox™ Green Dye for multiplexed detection of cytotoxicity and proliferation in the same well.

Figure: HCT116 cells (1,000 cells/well) were plated in SBio PrimeSurface 96U plates (ULA; round bottom) and grown for 3 days to form 3D spheroids. The resultant HCT116 spheroids were then treated for 24 hours with increasing concentrations of nutlin-3a. Subsequently, proliferation was assessed with the Lumit® Cell Proliferation Assay (Human Ki-67) and a metabolic activity assay in separate plates.
What Metabolic Assays Work in 3D Cell Cultures?
Energy metabolism is critical for cellular health and function and metabolites are linked to cellular energy, creation of cellular building blocks and signaling pathways. We offer several assays to measure metabolic activity with optimized protocols for 3D cell culture applications. Non-lytic options allow measurement from the same spheroid across multiple timepoints.
FEATURED PRODUCT
Glucose-Glo™ Assay
Sensitive bioluminescent measure of glucose. Requires only 2–5μl of conditioned cell culture media per time point allowing multiple samples per well for time course studies. Tested on microspheroid culture conditioned media.
Insulin-Mediated Inhibition of Gluconeogenesis of iCell® Hepatocyte Spheroids

GSH/GSSG-Glo™ Assay
Lytic Assay
Monitor changes in GSH/GSSG ratios with sensitive bioluminescent assays. Parallel wells are processed for total GSH + GSSG and GSSG only and results yield the GSH/ GSSG ratio. Minor protocol changes from monolayer (5 min shake) to 3D culture (30 min shake). CellTox™ Green can be used upstream to monitor cytotoxicity.
Monitoring Total Glutathione and Viability in Parallel Wells of HCT 116 Spheroids

Spheroids treated for 48 hours with buthionine sulfoximine prior to measurement of total glutathione with the GSH/GSSG-Glo™ Assay or CellTiter-Glo® 3D Assay. Details in Scientific Poster (link below).
ROS-Glo™ H2O2 Assay
Non-Lytic Assay Option
Monitor reactive oxygen species through a bioluminescent H2O2 assay. Proluciferin substrate reacts directly with H2O2 and assay components convert the activated prosubstrate to luciferin for bioluminescent detection. Same protocol for monolayer and 3D cultures. Cells may be used for other cell-based assays or nucleic acid extraction.
Response of HepG2 Spheroids to ROS-inducing Menadione

Response of HepG2 spheroids of differing diameters to different levels of menadione. Cells incubated 4 days in ultra-low attachment plates (Corning). H2O2 levels measured with the ROS-Glo™ H2O2 assay and read on a GloMax® Discover Instrument. Details in Application Note (link below).
NAD/NADH-Glo™ and NADP/ NADPH-Glo™ Assays
Lytic Assay
Monitor NAD+/NADH or NADP/NADPH ratio with this lytic bioluminescent assay. Lysate is divided and through acid/base reaction measure either oxidized or reduced form of NAD+ or NADH. Slight modification to the standard monolayer protocol (details in poster link below).
Triglyceride Levels in Human Liver Microtissues

For full details, see the technical article linked below.
Lactate-Glo™ Assay
Non-Lytic Assay Option
Monitor lactate changes in 3D cultures using the non-lytic, sensitive bioluminescent assay option. Assay requires only 2–5μl of culture media per time point allowing multiple samples from the same well. Cells may be used for other cell-based assays or nucleic acid isolation.
Glutamate-Glo™ Assay
Non-Lytic Assay Option
Monitor glutamate changes in 3D cultures using the non-lytic, sensitive bioluminescent assay option. Assay requires on 2–5μl of culture media per time point allowing multiple samples from the same well. Cells may be used for other cell-based assays or nucleic acid isolation.
Glutamine/Glutamate-Glo™ Assay
Non-Lytic Assay Option
Monitor glutamine and glutamate changes in 3D cultures using the non-lytic, sensitive bioluminescent assay option. Glutamine measurement based on conversion of glutamine to glutamate. Assay requires only 2–5μl of culture media per time point allowing multiple samples from the same well. Cells may be used for other cell-based assays or nucleic acid extraction.
Glycerol-Glo™ Assay
Non-Lytic Assay Option
The Glycerol-Glo™ Assay is a bioluminescent assay for rapid and sensitive measurement of glycerol in a variety of biological samples including cells cultured in 3D. Glycerol is often measured as the product of lipolysis, where it is released from triglycerides. Any processes that result in changes in glycerol concentration, both extracellular and intracellular, can be studied with the Glycerol-Glo™ Assay.
Triglyceride-Glo™ Assay
Lytic Assay
The Triglyceride-Glo™ Assay is a bioluminescent assay for rapid and sensitive measurement of triglycerides in cultured cell lysates. The assay is ideal for measuring triglyceride accumulation and clearance in normal and pathological conditions.
Cholesterol/Cholesterol Ester-Glo™ Assay
Lytic Assay
The Cholesterol/Cholesterol Ester-Glo™ Assay is a bioluminescent assay for rapid and sensitive method for measuring cholesterol and cholesterol esters in cultured cell lysates and other biological samples, such as cell culture medium. Cholesterol is an essential lipid involved in steroidogenesis, bile acid synthesis, cell signaling and maintenance of membrane structure.
How Do I Analyze Live-Cell Protein Dynamics in 3D Cell Cultures?
Fluorescent imaging and protein-protein interaction assays enable direct observation of protein dynamics in 3D cell cultures. HaloTag® Ligands and NanoBRET® Technology provide non-destructive measurement in complex systems, supporting regulatory compliance with New Approach Methodologies (NAMs).
3D cell culture models more accurately reflect in vivo protein behavior than 2D systems because they preserve nutrient gradients, matrix interactions, and cell-cell contacts. However, these complexities require specialized detection methods that function reliably in living, three-dimensional environments.
As regulatory agencies increasingly favor alternatives to animal testing, approach such as New Approach Methodologies (NAMs) require GLP-compliant assays that work in 3D models. This shift is essential for drug development and toxicity screening.
Janelia Fluor® HaloTag® Ligands
Fluorescent Imaging
Janelia Fluor® HaloTag® Ligands enable non-destructive imaging of complex 3D cell cultures. The strong covalent binding between the HaloTag® protein and HaloTag® ligands ensures stable and persistent labeling, supporting clear and reliable imaging over extended periods.
Janelia Fluor® HaloTag® Ligands Retain Fluorescence in Cerebral Spheroids for 45 Days With Single Ligand Addition

NanoBRET® Nano-Glo® Detection Systems
The NanoBRET® Assay is a bioluminescence resonance energy transfer (BRET)-based assay to measure the interaction of two binding partners in live cells. NanoBRET® Technology enables sensitive, reproducible detection of protein interactions in the natural cellular environment. Learn how this assay can be used to study protein-protein interaction in 3D spheroids in this peer-reviewed publication: Bioluminescence-based assays for quantifying endogenous protein interactions in live cells.
NanoBRET® PPI Assay Principle

How Do I Analyze Gene Expression in 3D Cell Cultures?
Cells grown in 3D culture can have differences in gene expression when compared to monolayer cultures. The changes in cell-to-cell contacts and cell-to-matrix contacts will be very different and the gradient of oxygen and nutrients within the culture will also influence gene expression. To analyze differences in gene expression, RNA must be isolated and quantified. Then, specific genes are analyzed by RT-qPCR or cellular changes are monitored through techniques like RNA-seq.
FEATURED PRODUCT
ReliaPrep™ RNA Miniprep Systems
Isolate application-ready total RNA or miRNA from 3D cultures to monitor changes in expression. The ReliaPrep™ RNA Miniprep Systems synergize with non-lytic cellular assays like the RealTime-Glo™ MT Cell Viability Assay.
Extraction of RNA from HEK293 Microtissue Spheroids

What Complementary Assays Support Gene Expression Analysis in 3D Cell Cultures?
How Do I Perform Genomic Analysis on 3D Cell Cultures?
Understanding genotype-phenotype or phenotype-genotype differences is important, especially when studying primary cells or tumors. You may analyze a genotype and use 3D cell culture to understand the phenotype or you may choose to study the phenotype and then look at the genotype to understand why these changes occur. For genomic DNA analysis, you will need to extract and quantify the DNA. Then you will look at specific genes through qPCR or choose to examine the genome with NGS. If you are working with primary cells, you must be able to differentiate which sample came from which donor—STR profiles are often chosen for that task. The STR profile is also important for confirming that the cells you are working with are truly the cells you desire.
FEATURED PRODUCT
Maxwell® RSC Cultured Cells DNA Kit
Isolate application-ready genomic DNA from 3D cultures for genomic analyses with a simple, walk-away automated protocol using a Maxwell® RSC Instrument. Purified DNA is ready for analysis in about 45 minutes. Isolated gDNA can be used for qPCR-based analyses for gene copy number and biomarkers, STR-based analysis for sample tracking or verification, and sequencing-based analyses.
Concentration of DNA Isolated with the Maxwell® RSC Cultured Cells DNA Kit From Various Starting Amounts of HCT116 Cells

What Complementary Assays Support Genomic Analysis in 3D Cell Cultures?
Assay Selection Matrix: 3D Culture Applications
Use this matrix to choose the right assay(s) based on your 3D model type, workflow needs, and downstream applications.
| Assay Name | Assay Type | Lytic? | 3D Model Best For | Downstream Options | Multiplex Friendly? |
|---|---|---|---|---|---|
| CellTiter-Glo® 3D | Cell Viability (ATP) | Lytic | Spheroids, organoids, etc. | No | Yes (with LDH-Glo™, CellTiter™) |
| RealTime-Glo™ | Cell Viability | Non-Lytic | All 3D models | RNA/DNA extraction | Yes (with CellTiter™ Green) |
| LDH-Glo™ | Cytotoxicity (media) | Non-Lytic | All 3D models | Cell viability follow-up | Yes (multiple timepoints) |
| CellTiter™ Green | Cytotoxicity (live) | Non-Lytic | All 3D models | Cell viability follow-up | Yes (with RealTime-Glo™) |
| Caspase-Glo® 3/7 | Apoptosis | Lytic | Spheroids, organoids | No | Yes (with CellTiter™, CellTiter-Glo®) |
| Annexin V | Apoptosis + Necrosis | Non-Lytic | All 3D models | RNA/DNA extraction | Yes (Caspase-Glo® or RealTime-Glo™) |
| P450-Glo™ | Drug Metabolism | Non-Lytic | Hepatocyte spheroids | Cell viability follow-up | Yes (same protocol, compatible) |
| LC3 HIBIT | Autophagy | Non-Lytic | Transfected 3D spheroids | Microscopy analysis | Compatible with viability assays |
| Extracellular ATP | Immunogenic Cell Death | Non-Lytic | All 3D models | Other death markers | Yes (kinetic monitoring) |
| Glucose-Glo™ | Glucose Metabolism | Non-Lytic | All 3D models | Other metabolic assays | Yes (multiple timepoints/wells) |
| NAD/NADH-Glo™ | Redox State | Lytic | Spheroids, organoids | No | Parallel wells (not same well) |
| Lactate-Glo™ | Lactate Metabolism | Non-Lytic | All 3D models | Other metabolic assays | Yes (multiple samples/well) |
| GSH/GSSG-Glo™ | Oxidative Stress | Lytic | Spheroids, organoids | No | Parallel wells (not same well) |
| ROS-Glo™ H2O2 | Oxidative Stress | Non-Lytic | All 3D models | Other stress markers | Yes (downstream assays) |
| Glycerol-Glo™ | Lipid Metabolism | Non-Lytic | Hepatocyte, adipocyte models | Other lipid assays | Yes |
| Triglyceride-Glo™ | Lipid Accumulation | Lytic | Hepatocyte, adipocyte models | No | Parallel wells |
| Cholesterol-Glo™ | Lipid Metabolism | Lytic | Hepatocyte, steroidogenic models | No | Parallel wells |
FAQ
Can I use standard CellTiter-Glo® Assay or CellTiter-Glo® 2.0 for 3D cell cultures?
Use the CellTiter-Glo® 3D Cell Viability Assay because it is specifically optimized for 3D models and ensures complete lysis. CellTiter-Glo® or CellTiter-Glo® 2.0 may not have sufficient lytic performance to ensure complete lysis of 3D models, which could lead to unintended bias and increased variability in the assay readout.
Which assay should I use for spheroids vs. organoids?
Both spheroids and organoids are compatible with most Promega 3D assays. Key differences: spheroids are simpler, typically cell-type homogeneous; organoids contain multiple cell types with distinct tissue architecture. For organoids, non-lytic assays often perform better (RealTime-Glo™ MT, metabolic activity assays) to preserve tissue structure. Consult assay-specific application notes for optimized protocols.
Can I multiplex assays in the same 3D culture well?
It depends on the assay—same-well multiplexing is a major advantage for several 3D assays. For example: measure viability with RealTime-Glo™ MT, then add CellTox™ Green to detect dead cells in the same well, continuing kinetic monitoring. Consider extracting DNA or RNA from the same well for genomic characterization or expression analysis (e.g., using ReliaPrep™ Miniprep systems, or Maxwell® RSC Kits). Always verify assay compatibility in technical manuals, or consider reaching out to Promega Technical Services to discuss options (techserv@promega.com).
Do I need to lyse my spheroid for cell viability measurement?
Not always. Choose based on your workflow: Lytic assays (CellTiter-Glo® 3D, NAD/NADH-Glo™) fully lyse spheroids and penetrate cores completely, but remove the ability to run further assays on the samples. Non-lytic assays (RealTime-Glo™ MT, metabolic assays) preserve cells and are best for kinetic or multi-measurement workflows. Additionally, non-lytic assays allow for potential multiplexing with other assays to interrogate other aspects of the spheroid biology (e.g., metabolic markers), and for downstream DNA/RNA extraction.
Which assays are validated for high-throughput screening (HTS) in 3D?
Promega offers a wide portfolio of bioluminescent assays specifically designed to be high-throughput compatible. These include CellTiter-Glo® 3D, Caspase-Glo® 3/7 3D Assay, These assays are HTS-compatible and scalable to 384-well plates. Multi-dose studies can run in parallel wells. Check application notes for recommended timepoints, plate types, and GloMax® plate reader settings for 3D-specific optimization.
Can I use the same 3D culture well for multiple assay measurements?
Yes, with non-lytic assays. Example workflow: (1) Day 0–3: kinetic viability monitoring with RealTime-Glo™ MT; (2) Day 3: media supernatant samples for metabolic activity screening (e.g., glucose and/or lactate measurements from 5 µl media, measured in a separate plate); (3) Day 5: extract RNA from intact spheroid; (4) Day 5: run RT-qPCR on extracted RNA. Lytic assays consume the sample and prevent downstream analysis.
What is the typical timeframe for 3D culture assays?
Spheroids/organoids are typically measured 48 hours to 7 days post-seeding. Kinetic assays (RealTime-Glo™ MT) provide continuous monitoring across this range. Lytic assays (CellTiter-Glo® 3D) work best at endpoint (3–7 days). Optimization may be required based on cell type and model. See assay application notes for specific recommendations.
Do Promega 3D assays work with different plate types?
Yes. Ultra-low attachment plates (ULA) are standard for spheroid culture and compatible with all assays. Hanging drop plates also work. For organoids, your choice depends on culture method. Hydrogel-based cultures are compatible; verify with assay-specific technical documentation. Plate geometry may affect penetration kinetics. Always make sure to test in your model system to ensure plate compatibility.
What platforms measure Promega 3D assays?
GloMax® readers are primary platforms for luminescent assays. GloMax® Discover Instrument supports combined luminescence + fluorescence for multiplexing. For kinetic reads over 72 hours, ensure your cells are cultured under the appropriate environmental conditions. Fluorescence assays (e.g., CellTox™ Green) work on any fluorescence plate reader.
How do I perform genomic analysis on 3D culture systems like spheroids and organoids?
Genomic analysis of 3D cultures follows three main steps: harvest, nucleic acid extraction, and downstream analysis.
- Step 1. Recover cells from their matrix (e.g., dissolve hydrogels, optionally dissociate spheroids enzymatically). The extracellular matrix and the compact architecture of spheroids and organoids can lower yields and trap inhibitors, so gentle, thorough lysis is critical.
- Step 2. Extract DNA or RNA. For low-input or precious samples, automated systems such as the Maxwell® System of instruments and kits improve reproducibility across replicates. Column-based options, such as ReliaPrep™ Miniprep systems, suit budget-friendly manual workflows or small sample numbers. Because 3D structures often yield less material than 2D monolayers, consider pooling multiple organoids or selecting kits validated for low-input samples.
- Step 3. Analysis. Extracted nucleic acids can feed into qPCR, RT-qPCR, whole-genome or RNA sequencing, methylation analysis, or genotyping to characterize gene expression, mutations, or clonal heterogeneity.
To maximize data from limited samples, you can also extract DNA/RNA from the same well used for upstream viability or cytotoxicity assays. Always verify compatibility first. For help matching an extraction method to your model and downstream application, contact Promega Technical Services (techserv@promega.com).
How do I measure live-cell protein dynamics in 3D cultures?
HaloTag® and NanoLuc® reporters let you track protein abundance, localization, and turnover in living spheroids and organoids without destroying the model. HaloTag, paired with cell-permeable Janelia Fluor® ligands, enables live-cell imaging of protein localization and turnover, including pulse-chase studies, in advanced 3D models. Combined with NanoLuc® reporters, the system delivers real-time, non-destructive monitoring of 3D systems where endpoint assays fall short. Promega scientists have used a HaloTag®-NanoLuc® fusion with Janelia Fluor® ligands to quantify protein expression and measure real-time neuritogenesis in cerebral spheroids over multi-day timecourses. Because real-time 3D imaging requires signals that persist for days while preserving spheroid viability, validate ligand and substrate longevity and penetration in your model (see Q1).
For 3D-specific guidance, see the white paper "Real-Time Monitoring of Cerebral Organoids Using NanoLuc® and HaloTag® Technologies".
Interested in more physiologically relevant research tools?
Explore our full portfolio of tools for detecting biologically relevant protein dynamics and cellular activity.