Metabolic Disease Research Solutions
Metabolic diseases encompass a range of disorders arising from disruptions in the body's metabolic processes, leading to significant health challenges worldwide. Understanding and addressing these conditions require advanced research tools and methodologies.
Featured Metabolic Diseases
Obesity
Obesity is a multifaceted metabolic disease influenced by genetic, hormonal, and inflammatory factors. Learn about innovative tools for studying obesity, targeting key pathways such as GPCRs, hormone signaling, inflammatory cytokines, and muscle metabolism.

Immuno-oncology
The intersection of metabolism and immune function is crucial in cancer research. Metabolic pathways influence tumor progression and the efficacy of immunotherapies. Explore our immuno-oncology applications to discover how we support research in this dynamic field.
Diabetes
Characterized by impaired glucose metabolism, diabetes research benefits from precise analytical tools. We offer assays and technologies to advance understanding and treatment of this pervasive disease.

Liver Disease
As the central organ in metabolic regulation, the liver's health is vital. We provide research tools to better understand hepatic function and pathology, aiding in the study of conditions like NAFLD and NASH.

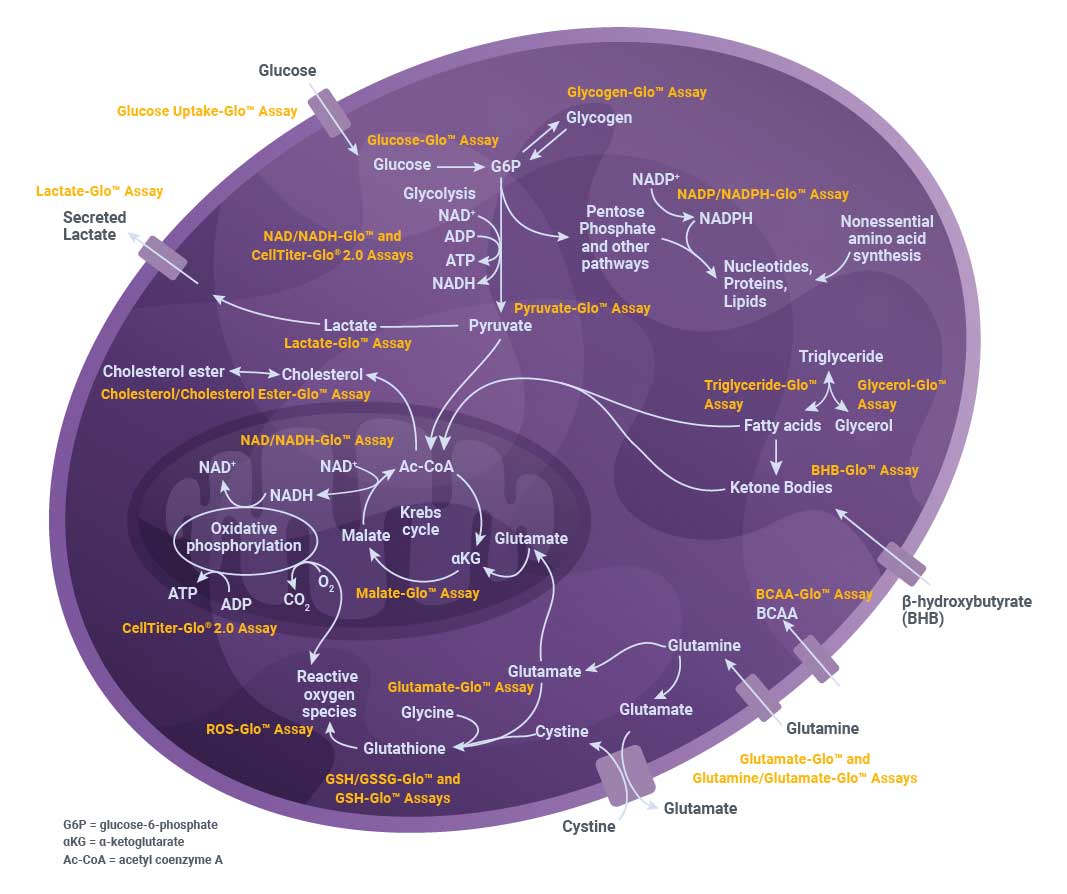
Metabolic Activity Assays
Our bioluminescent metabolic activity assays are a simple, sensitive and scalable way to get a comprehensive view of cellular metabolism. This diagram shows the metabolic pathways involved in glucose, amino acid and lipid metabolism and the assays we offer to measure metabolic activity.
Resources
Webinar: Method Validation and 3D Islet Microtissues for Diabetes Research
Learn how to verify bioluminescent assay performance in 3D models, including assays to measure cell viability, apoptosis, and hormone secretion.
Blog: Monitoring Cellular Metabolism for NAFLD/NASH Liver Disease Research
In this blog, Dr. Jolanta Vidugiriene, Senior Research Scientist at Promega Corporation, discusses tools for studying metabolism in NAFLD/NASH research.Webinar: How to Integrate Cellular Metabolism Assays Into Your Research
Learn about bioluminescent assays for measuring key metabolites and factors to consider when designing experiments, including assay sensitivity, linear range, and sample preparation.