NAFLD and NASH Liver Disease Research Tools
Liver diseases including nonalcoholic liver disease (NAFLD) and nonalcoholic steatohepatitis (NASH) are chronic conditions with no effective treatment. To support researchers studying liver diseases, we offer easy, reliable methods to measure cellular metabolism, oxidative stress and inflammation. Our assays use luminescent technology for sensitive detection, and the protocols are fast and simple.
Explore the products and resources below to see how we can support your research.
What are Nonalcoholic Fatty Liver Disease (NAFLD) and Nonalcoholic Steatohepatitis (NASH)?
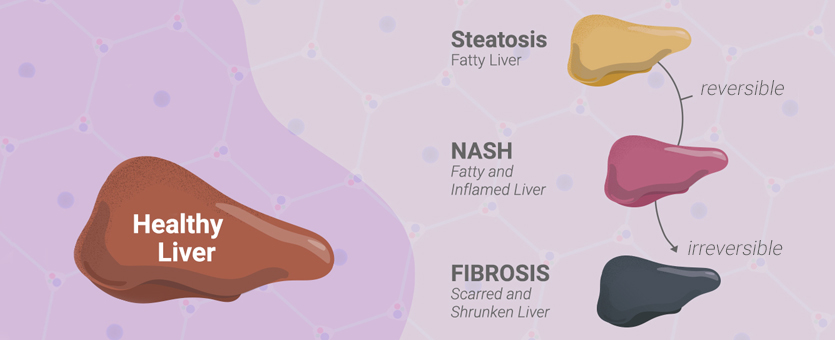
Nonalcoholic fatty liver disease (NAFLD) is an umbrella term to describe a spectrum of conditions where there is excessive accumulation of fat (including triglycerides, free fatty acids and cholesterol) in the liver. Two types of NAFLD are nonalcoholic fatty liver (NAFL), where there is little to no inflammation in the liver, and nonalcoholic steatohepatitis (NASH), where fat accumulation is accompanied by inflammation and liver damage. If undiagnosed, NAFLD can eventually progress to liver fibrosis, cirrhosis and primary liver cancer.
NAFLD is very common, affecting >25% of adults worldwide. However, there are currently no FDA-approved drug treatments for the disease. The disease is complex, with many environmental and genetic factors contributing to its origin and progression. Adding to the complexity, the pathology of the disease is systemic because the liver is a hub for many metabolic pathways. Assays for monitoring metabolic pathways and cell health are critical to advance our understanding of NAFLD and to develop treatments for the disease.
Promega assays offer a number of advantages for liver disease research:
- Broad sample compatibility allows continuity across projects—from simple, cell models to complex 3D organoids and tissue samples.
- Luminescent detection is sensitive, allowing precise monitoring of biological changes.
- Wide linear range captures 1,000-fold changes in metabolite concentration without any sample dilution.
- Miniaturization allows rapid inhibitor screening in high-throughput formats.
How to Measure Triglyceride Homeostasis and Steatosis
The hallmark pathology of NAFLD is accumulation of triglycerides in hepatocytes, also called steatosis. Excess triglycerides come from two main sources. First, free fatty acids (FFA) from dietary lipids and adipose tissues are converted to triglycerides via lipogenesis. Second, insulin resistance promotes de novo lipogenesis, where triglycerides are synthesized from carbohydrates.
You can easily measure steatosis and lipogenesis with the Triglyceride-Glo™ Assay. It can be used with diverse sample types, including lysed cells, culture medium, tissue homogenates, serum, and lipoprotein fractions. The simple, no-wash protocol uses sensitive bioluminescent detection, providing superior results compared to staining, colorimetric or fluorescent plate-based assays. Instead of cumbersome organic extraction, the assays use a quick detergent lysis step to prepare lipid samples. Similarly, the Glycerol-Glo™ Assay can be used to measure lipolysis.
BSA-bound fatty acids and lipoproteins stimulate intracellular triglyceride accumulation in hepatocytes via lipogenesis. Here, we used the Triglyceride-Glo™ Assay to monitor triglyceride content of human liver 3D microtissues across several treatment conditions and over time. The results demonstrate that the Triglyceride-Glo™ Assay can be used to monitor the progression of steatosis in cell models.

Triglyceride levels in human liver microtissues. 3D InSight™ Human Liver Microtissues (InSphero) were incubated for 3 and 10 days in serum-free medium containing either physiological (LG/LI) or supraphysiological (LG/HI) levels of glucose and insulin and supplementation with either free fatty acids bound to BSA (FFA) or low density lipoprotein plasma fraction (LDL). The microtissues were washed twice in PBS and assayed for total glycerol content according to the Triglyceride-Glo™ protocol. Values were plotted as concentration of triglyceride per microtissue (MT). The data were generously provided by InSphero, AG, Zurich, Switzerland.
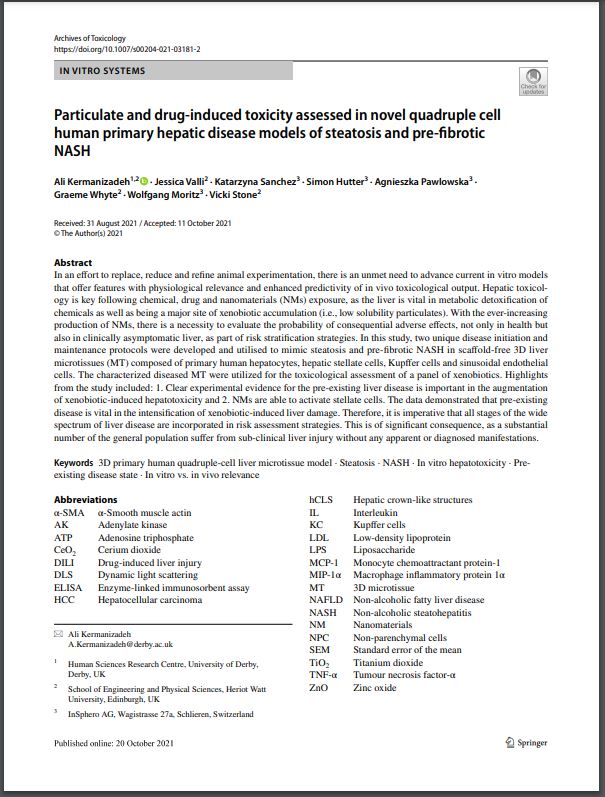
Featured Study: Assessing Drug-Induced Toxicity in NASH Cell Models
Kermanizadeh et al. demonstrated in this study that pre-existing disease is vital in the intensification of xenobiotic-induced liver damage. They used the Triglyceride-Glo™ Assay to monitor lipid accumulation in 3D human liver microtissues, alongside CellTiter-Glo® 2.0 to monitor viability.
How to Measure Glucose Metabolism
In hepatocytes of fatty liver, studies show changes in glucose metabolism, including increased glycolysis, lactate production and gluconeogenesis. Hepatic insulin resistance in NAFLD contributes to this dysregulation. We offer a suite of assays that enable you to detect changes in glucose metabolism with high sensitivity.
- Gluconeogenesis, the synthesis of new glucose molecules, can be monitored using the Glucose-Glo™ Assay.

- Glycolysis, the breakdown of glucose for energy, can be measured using the Glucose-Glo™ and/or Lactate-Glo™ Assays.
- Glycogenesis and glycogenolysis, the synthesis and breakdown of glycogen, can be monitored using the Glycogen-Glo™ Assay.
- Glucose uptake rate can be measured using the Glucose Uptake-Glo™ Assay.
Featured Study: Understanding the Anticancer Effect of Metformin
Cai et al. discovered the beneficial effect of metformin on reducing chemo-resistance in HepG2 cells, which could help improve chemotherapy of liver cancers. They used a series of Promega assays (Glucose Uptake-Glo™, Glucose-Glo™, Lactate-Glo™ and NADP/NADPH-Glo™ Assays) to measure glycolysis in HepG2 hepatocellular carcinoma cells.
Poster: Bioluminescent Assays for Investigating Insulin Action and Steatosis
See data on how bioluminescent assays can be used to measure insulin, glucagon, lipolysis and glucose uptake.
How to Measure Cholesterol and Lipoproteins
NAFLD is associated with elevated hepatic cholesterol and changes in lipoprotein production. The Cholesterol/Cholesterol Ester-Glo™ Assay can be used to quantify total cholesterol levels, free cholesterol levels and cholesterol ester levels. The simple protocol is compatible with cell lysates, tissues, medium, serum samples and lipoproteins.
When the liver is overloaded with FFA, very low-density lipoproteins (VLDL) are used to export FFA to adipose tissue. Therefore, NAFLD patients exhibit increased low-density lipoproteins (LDL and VLDL) and decreased high-density lipoproteins (HDL) in serum. Here, we use the Cholesterol/Cholesterol Ester-Glo™ Assay to measure cholesterol content of human lipoprotein samples.

Purchased human high density and low density lipoproteins were assayed for both total (samples + esterase) and free cholesterol. Concentrations were calculated using a 40μM cholesterol standard. Relative light unit (RLU) values (in millions) are listed at the top of each bar.
How to Measure Oxidative Stress and Cell Death
Oxidative stress is a central contributor to the progression of NAFLD. Steatosis in the liver causes mitochondrial dysfuction, ER stress, and lipotoxicity, all of which contribute to excess reactive oxygen species (ROS) production. Build-up of ROS is detrimental, causing cellular injury, death, and hepatic fibrosis. Excessive ROS buildup eventually leads to cell death, another key process involved in NAFLD/NASH pathogenesis. The ROS-Glo™ H2O2 Assay can be used to measure oxidative stress in cells. It uses sensitive luminescent detection to measure H2O2 with a fast, no-wash protocol.
Here, we show parallel detection of oxidative stress and cell death in HepG2 cells by multiplexing ROS-Glo™ with CellTox™ Green Cytotoxicity Assay.

HepG2 cells were treated with either ROS-generating compounds (menadione or pyrogallol) or a cytotoxicity inducing reagent (digitonin) and incubated at 37°C for 2 hours. CellTox™ Green Dye (membrane impermeable DNA binding dye as an indicator of cytotoxicity) and H₂O₂ Substrate were added at the time of dosing. After incubation fluorescence from the CellTox™ Green Dye was measured followed by addition of ROS-Glo™ Detection Solution. Luminescence signal from the ROS-Glo™ Assay was measured following 20 minute incubation.
How to Measure Inflammatory Cytokines
Oxidative stress promotes chronic inflammation in the liver, including the release of pro-inflammatory cytokines. Traditionally, cytokines are measured using ELISA, which is often slow and requires multiple wash steps. We offer an ELISA-alternative: Lumit® Immunoassays, which are fast and easy, with no wash steps. They can be performed directly in-well with cells to detect the release of cytokines including TNF-α, IL-1β, IL-6, HMGB1 and many other molecules of interest.
How to Use 3D Cell Models for Liver Research
To understand the complex pathophysiology of NAFLD, researchers are turning to more physiologically relevant 3D cell models such as liver spheroids and microtissues. Interested in implementing Promega assays in 3D liver models? See examples in these webinars: