Kinase Selectivity Profiling Services

Service Overview
Our Assay
Our kinase selectivity profiling services use NanoBRET® Target Engagement Intracellular Kinase Assays to test your supplied compounds. It includes a diverse panel of 192 or 300 full-length kinases transiently expressed in HEK293 cells.
Your Data
- Quantitative measurement of compound affinity and occupancy in live cells
- Includes cellular selectivity and off-target activity
- Ratiometric BRET data provide reproducibility with low error rates
- Both single point and dose response data with technical duplicates
Service Schedule
Monthly or on-demand runs
Turnaround Time
2–3 weeks
Why Choose Us
- Trusted NanoBRET® Target Engagement technology
- Close collaboration with our scientists from start to finish
- Cellular assay provides biologically relevant results
Technology Overview
How NanoBRET® Target Engagement Works
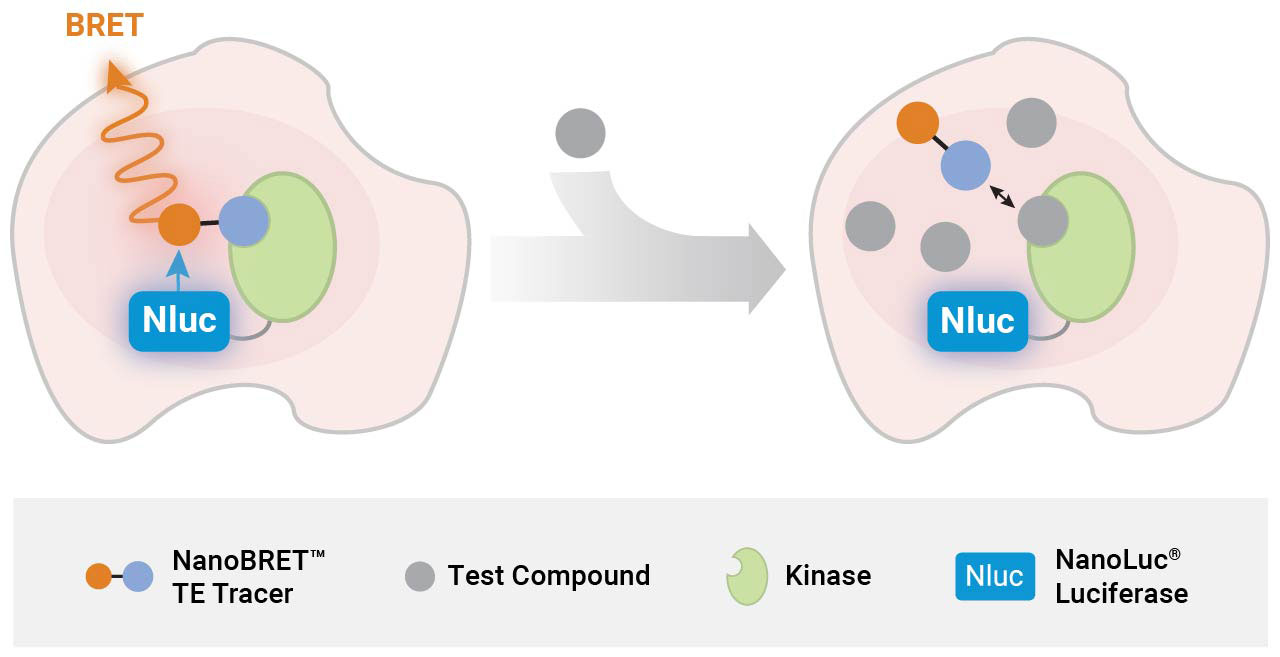
Advantages of Cellular vs. Biochemical Kinase Assays
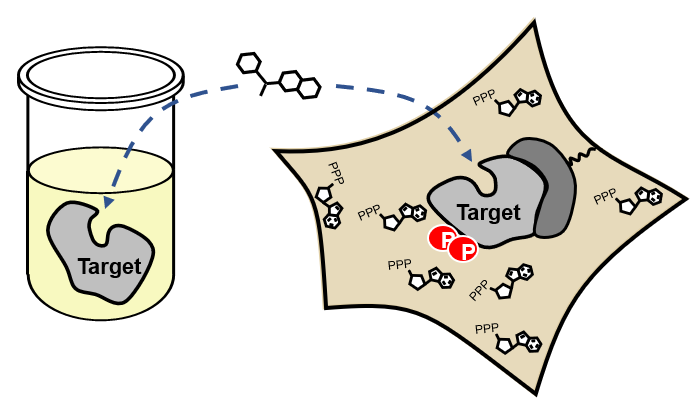
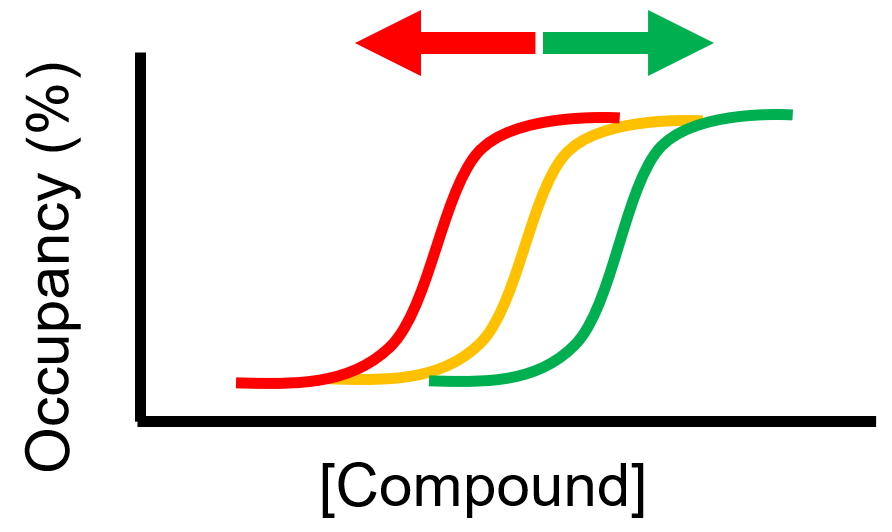
Various cellular conditions can result in right- or left-shifted occupancy:
- Protein complexes
- Target activation state
- Compartmentalization
- Plasma membrane
- Efflux
- Unpredictable metabolites (e.g., nucleotides)
Improved Kinase Selectivity Profile Using Cellular Method
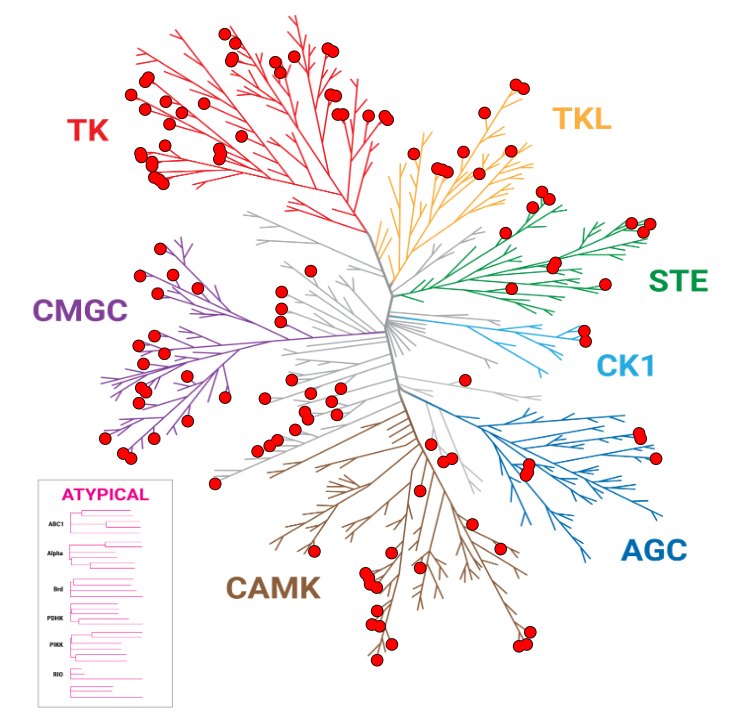
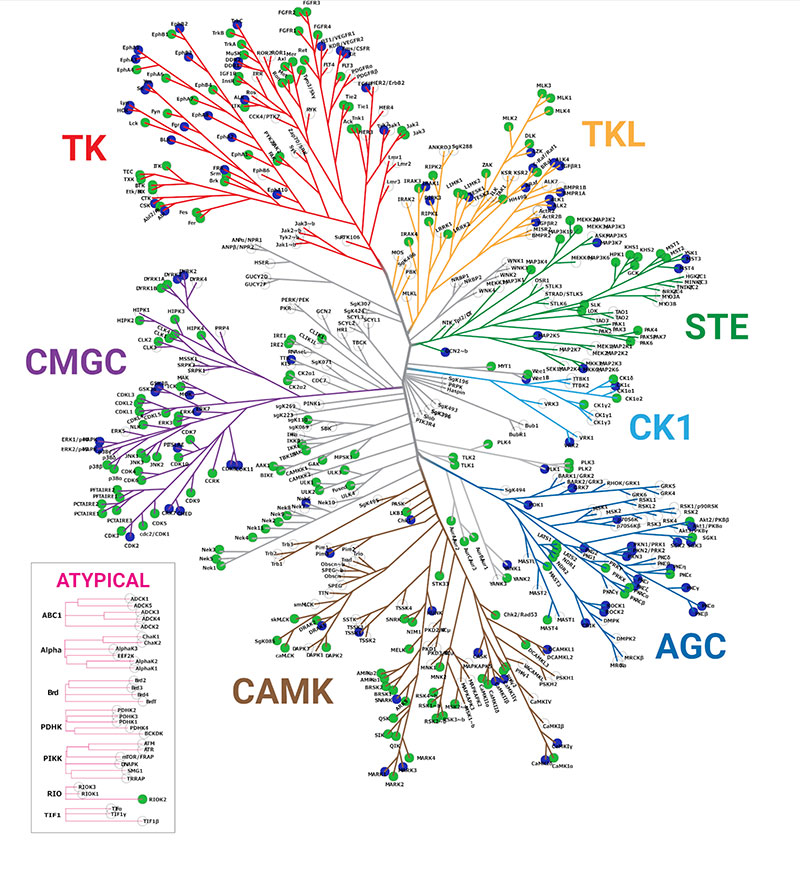
These dendrograms show the target occupancy obtained with 10µM dabrafenib using the live-cell NanoBRET® TE K240 Kinase Selectivity Panel compared to a biochemical cell-free approach. The kinases with an occupancy >50% are marked with red dots. The results showed an improved spectrum of activity in cells, with 50 targets engaged by dabrafenib using the NanoBRET® TE method, compared to 123 kinases engaged using the biochemical approach.
NanoBRET® TE: 50 Hits
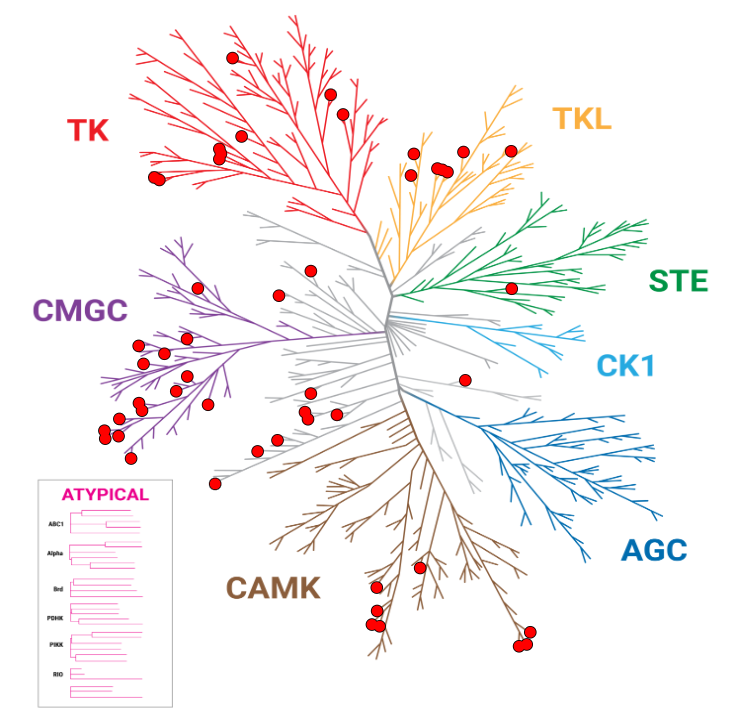
Biochemical: 123 Hits
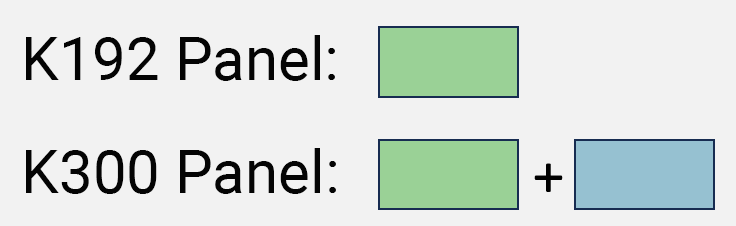
Kinase Panel
Our panels include kinases spread broadly across the kinome. Click below for a full list of kinases included in our K192 (192 full-length kinases) and K300 (300 full-length kinases) panels.
| AAK1 | CDK14 + Cyclin Y | DCLK3 | GSK3B | MAP3K7/TAB1 | NEK9 | PRKCH | STK26 |
| ABL1 | CDK15 + Cyclin Y | DDR1 | HCK | MAP3K9 | NIM1K | PRKCQ | STK3 |
| ABL2 | CDK16 + Cyclin Y | DDR2 | HIPK2 | MAP4K1 | NLK | PRKG2 | STK32A |
| ACVR1 | CDK17 + Cyclin Y | DYRK1A | HIPK3 | MAP4K2 | NTRK1 | PRKX | STK32B |
| ACVR1B | CDK18 + Cyclin Y | DYRK1B | HIPK4 | MAP4K3 | NTRK2 | PTK2 | STK33 |
| ACVRL1 | CDK19 + Cyclin C | DYRK2 | HUNK | MAP4K5 | NTRK3 | PTK2B | STK35 |
| ADK | CDK2 + Cyclin A1 | DYRK3 | ICK | MAPK1 | NUAK1 | PTK6 | STK36 |
| AKT1 | CDK2 + Cyclin E1 | EGFR | IGF1R | MAPK11 | NUAK2 | RET | STK38 |
| AKT2 | CDK20 + Cyclin H | EIF2AK4 k2 domain | IKBKE | MAPK14 | PAK4 | RIOK2 | STK38L |
| ALK | CDK3 + Cyclin E1 | EPHA1 | INSR | MAPK15 | PAK6 | RIPK1 | STK4 |
| ARAF | CDK4 + Cyclin D3 | EPHA10 | IRAK1 | MAPK3 | PDPK1 | RIPK2 | TBK1 |
| AURKA | CDK5 + CDK5R1 | EPHA2 | IRAK3 | MAPK4 | PHKG1 | RIPK3 | TEC |
| AURKB | CDK6 + Cyclin D1 | EPHA3 | IRAK4 | MAPK6 | PHKG2 | ROCK1 | TEK |
| AURKC | CDK7 | EPHA4 | ITK | MAPK8 | PIK3C3 | ROCK2 | TESK1 |
| AXL | CDK8 + Cyclin C | EPHA5 | JAK2 | MAPK9 | PIK3CA + PIK3R1 | RON | TGFBR1 |
| BLK | CDK9 + Cyclin K | EPHA6 | JAK2 (V617F) | MARK1 | PIK3CB + PIK3R1 | RPS6KA1 | TGFBR2 |
| BMP2K | CDKL1 | EPHA7 | JAK3 | MARK2 | PIK3CD + PIK3R1 | RPS6KA2 | TIE1 |
| BMPR1A | CDKL2 | EPHA8 | JNK3 | MARK3 | PIKFYVE | RPS6KA3 | TLK1 |
| BMX | CDKL3 | EPHB1 | KIT | MARK4 | PIM3 | RPS6KA4 | TLK2 |
| BRAF (V600E) | CDKL5 | EPHB2 | LATS1 | MAST3 | PIP4K2C | RPS6KA6 | TNK1 |
| BRAF | CHEK1 | EPHB3 | LATS2 | MAST4 | PIP5K1B | RPS6KB1 | TNK2 |
| BRSK1 | CHEK2 | EPHB4 | LCK | MELK | PKMYT1 | SBK3 | TNNI3K |
| BRSK2 | CIT | ERN1 | LIMK1 | MERTK | PKN1 | SGK1 | TSSK1B |
| BTK | CLK1 | ERN2 | LIMK2 | MET | PKN2 | SGK2 | TTK |
| CAMK1 | CLK2 | FER | LRRK2 | MKNK2 | PKN3 | SGK3 | TXK |
| CAMK1D | CLK4 | FES | LTK | MLTK | PLK1 | SIK1 | TYK2 |
| CAMK1G | COQ8B | FGFR1 | LYN | MOK | PLK2 | SIK2 | TYRO3 |
| CAMK2A | CRAF | FGFR2 | MAP2K5 | MUSK | PLK3 | SIK3 | ULK1 |
| CAMK2B | CSF1R | FGFR3 | MAP2K6 | MYLK2 | PLK4 | SLK | ULK2 |
| CAMK2D | CSK | FGFR4 | MAP3K10 | MYLK3 | PRKAA1 | SNRK | ULK3 |
| CAMK2G | CSNK1A1L | FGR | MAP3K11 | MYLK4 | PRKAA2 | SRC | VRK2 |
| CASK | CSNK1D | FLT1 | MAP3K12 | NEK1 | PRKACA | SRMS | WEE1 |
| CDK1 + Cyclin B1 | CSNK1E | FLT3 | MAP3K13 | NEK11 | PRKACB | STK10 | WEE2 |
| CDK10 + Cyclin L2 | CSNK1G2 | FRK | MAP3K19 | NEK2 | PRKCA | STK11 | YES1 |
| CDK11A + Cyclin K | CSNK2A1 | FYN | MAP3K2 | NEK3 | PRKCB | STK16 | |
| CDK11B + Cyclin B | CSNK2A2 | GAK | MAP3K21 | NEK4 | PRKCD | STK17A | |
| CDK12 | DAPK2 | GRK7 | MAP3K3 | NEK5 | PRKCE | STK17B | |
| CDK13 | DCLK1 | GSK3A | MAP3K4 | NEK6 | PRKCG | STK24 |
See the Kinase Target Engagement Assay Selection Table for a full list of kinase vectors available for use with NanoBRET® TE Intracellular Kinase Assays. Tell us which kinase you are looking for and we can help!
Want to run the kinase selectivity assay yourself?
We offer the NanoBRET® Target Engagement (TE) K192 Kinase Selectivity System that can be run in your lab to quantitatively measure intracellular compound occupancy against a panel of 192 kinases in a single experiment.
Data
Easily Follow up Your Hits with Compound IC50 Determinations
Our service can help you determine compound affinity for kinase hits. Example data below shows the IC50 kinase profiles for individual kinase hits identified from selectivity profiling data.

Explore another example:

Publications
The NanoBRET® TE Kinase Selectivity System is the chosen method in a variety of peer-reviewed publications. See details in the following publications:
- Vasta, J.D. et al. (2018) Quantitative, Wide-Spectrum Kinase Profiling in Live Cells for Assessing the Effect of Cellular ATP on Target Engagement. Cell Chem. Biol. 25, 206.
- Wells, C. et al. (2020) Quantifying CDK Inhibitor Selectivity in Live Cells. Nat. Commun. 11(1), 2743.
- Ong, L.L. et al. (2020) A High-Throughput BRET Cellular Target Engagement Assay Links Biochemical to Cellular Activity for Bruton’s Tyrosine Kinase. SLAS Discov. 25(2), 176.
- Robers, M.B. et al. (2015) Target Engagement and Drug Residence Time Can Be Observed in Living Cells with BRET. Nat. Commun. 6, 10091
- Jin, H.Y. et al. (2020) High-Throughput Implementation of the NanoBRET Target Engagement Intracellular Kinase Assay to Reveal Differential Compound Engagement by SIK2/3 Isoforms. SLAS Discov. 25(2), 215.