The Assay Guidance Manual: A Guide for In Vitro and In Vivo Assays in Early Drug Discovery
Johanna Lee and Mariel Mohns
Promega Corporation
Publication Date: December 2018, tpub 191
Abstract
The Assay Guidance Manual is a guide for scientists working in the early stages of drug development. The manual includes guidelines for selection, development and optimization of various in vitro and in vivo assays used for drug development. In this article, we highlight three chapters within the Assay Guidance Manual about cell viability assays, Short Tandem Repeat profiling analysis and cell-based assays for the detection of protein:protein interactions.
Introduction
In the early stages of drug development, proper use of in vitro and in vivo assays is critical for drug evaluation. But where do you begin? Which assays should you use? How do you analyze and validate results?
To help answer these questions, the NIH Chemical Genomics Center (NCGC) published an eBook called the Assay Guidance Manual (AGM). This eBook began as an internal guide within a pharmaceutical company, but now contains more than 40 chapters written by drug discovery scientists from academic, government and industrial research laboratories. The AGM eBook includes guidelines for selection, development and optimization of various in vitro and in vivo assays and how to adapt these assays for high-throughput screening. It also provides information on commercial products, potential assay interferences and statistical validation of assay performance.
Promega scientists contributed three chapters in the AGM; one on cell viability assays, another on authentication of human cell-lines using Short Tandem Repeat (STR) profiling analysis, and a third on cell-based assays for the detection of protein:protein interactions. We highlight these three chapters in this article.
Cell Viability Assays
Which common methods are used to measure cell viability?
One of the most common methods to detect cell viability in high-throughput workflows is by measuring ATP, which is only synthesized in viable cells. ATP can be measured using a bioluminescent assay with reagents containing stabilized luciferase and luciferin substrate. In the presence of ATP from viable cells, luciferase uses luciferin to generate luminescence, which is detected with a luminometer. The resulting luminescent signal is proportional to the number of viable cells. This method is great for high-throughput applications due to its superior sensitivity in higher density microwell plates.
Many older cell viability assays require incubation of a reagent with viable cells to convert a substrate to a colored or fluorescent product that can be detected using a plate reader with absorbance or fluorescence capability. The resulting signal is proportional to the number of viable cells, because dead cells lose the ability to convert substrate to product. This is the basis for many of the commonly used cell viability assays, including tetrazolium reduction (such as MTT or MTS), resazurin reduction and live-cell protease activity assays. These assays are less sensitive than bioluminescent methods and are used in lower throughput applications.
How can cell viability be monitored in real-time?
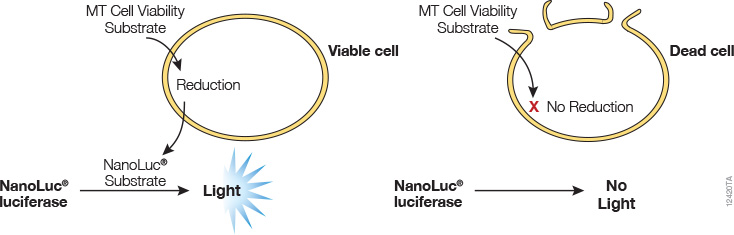
A real-time cell viability assay was developed by Promega (see figure below). In this assay, an engineered luciferase and a prosubstrate (which is not a substrate of luciferase) are added directly to the culture medium. The prosubstrate can penetrate cell membranes and enter cells. However, only viable cells with active metabolism can reduce the prosubstrate into a substrate for luciferase. The substrate then exits the cell where it is used by luciferase in the detection reagent to generate a luminescent signal. The same wells can be measured repeatedly for 3 days. The main advantages of this method are that it allows simple kinetic monitoring to determine dose response using fewer plates and cells. Also, because the method does not require cell lysis, the same cells can be used in additional cell-based assays or downstream applications.
Promega product: RealTime-Glo™ MT Cell Viability Assay (Cat.# G9711)
How do ATP cell viability assays work?
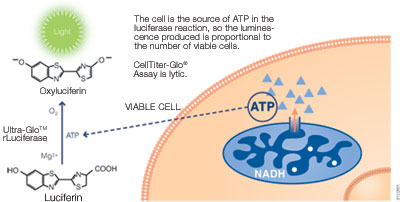
ATP can be used to detect cell viability since only viable cells can synthesize ATP. ATP can be measured using a bioluminescent assay with reagents containing detergent, stabilized luciferase and luciferin substrate. The detergent lyses viable cells, releasing ATP into the medium. In the presence of ATP, luciferase uses luciferin to generate luminescence, which can be detected within 10 minutes using a luminometer (see figure below). The ATP assay is faster than other methods since it does not require incubation to convert a substrate into a colored product. The assay has excellent sensitivity and broad linearity, making it highly compatible with high-throughput assays. It is also less prone to artifacts than other methods.
Promega products: CellTiter-Glo® Luminescent Cell Viability Assay (Cat.# G7570), CellTiter-Glo® 2.0 Assay (Cat.# G9241)
How does the protease viability marker assay work?
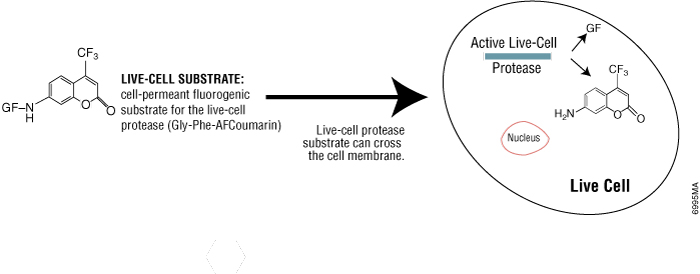
Some protease activities disappear rapidly after cell death, so they can be a useful marker of viable cells. Live-cell protease activity can be measured using a cell-permeable fluorogenic protease substrate (GF-AFC). The substrate enters live cells where it is cleaved by live-cell protease to generate a fluorescent signal proportional to the number of viable cells (see figure below). The incubation time for this method is 0.5–1 hour, which is shorter than tetrazolium assays (1–4 hours). Because this method does not lyse cells, it allows multiplexing with many other assays in the same sample wells, including bioluminescent cell-based assays.
Promega product: CellTiter-Fluor™ Cell Viability Assay (Cat.# G6080)
How do resazurin reduction cell viability assays work?
Resazurin is a cell-permeable redox indicator that is dark blue in color with little intrinsic fluorescence. Only viable cells with active metabolism can reduce resazurin into resorufin, which is pink and fluorescent. After 1–4 hours of incubation, the signal is quantified using a microplate spectrophotometer or fluorometer. This method is relatively inexpensive and more sensitive than tetrazolium assays. However, fluorescence from compounds being tested may interfere with resorufin readings.
Promega product: CellTiter-Blue® Cell Viability Assay (Cat.# G8080)
How do tetrazolium reduction cell viability assays work?
Tetrazolium compounds used to detect viable cells fall in two basic categories:
- Positively charged compounds (MTT) that readily penetrate viable cells: Viable cells with active metabolism are able to convert MTT into a purple-colored formazan product. Thus, color formation can be a useful marker of viable cells. However, the incubation time for this method is long (usually 4 hours). Also, the formazan product is insoluble, so a solubilizing reagent must be added prior to recording absorbance readings.
- Negatively charged compounds (MTS, XTT, WST-1) that do not penetrate cells: These compounds must be combined with intermediate electron coupling reagents, which can enter cells, be reduced and then exit the cell to convert tetrazolium to the soluble formazan product. The incubation time for this method is 1–4 hours. There is no need to add a solubilizing reagent since the resulting formazan is soluble, making it more convenient.
A disadvantage of all tetrazolium reduction assays is that they depend on the accumulation of colored or fluorescent products over time. Since the signal gradually increases over time, a decrease in viable cells during this long incubation cannot be detected.
Promega products: CellTiter 96® Non-Radioactive Cell Proliferation Assay (Cat.# G4000), CellTiter 96® AQueous One Solution Cell Proliferation Assay (Cat.# G3582)
Download the Assay Guidance Manual to learn more about these cell viability assays.
Cytotoxicity Assays
Which common methods are used to measure cytotoxicity?
There are two commonly used methods of estimating dead cells; both methods take advantage of the loss of membrane integrity and the ability of indicator molecules to partition into a compartment not achievable if the cell membrane is intact. As illustrated in the following image, assays used to detect dead cells include measuring the leakage of a component (usually an enzyme marker) from the cytoplasm into the culture medium or the penetration of an otherwise non-permeable dye into cells with a compromised membrane.
Promega products: CytoTox-Glo™ Cytotoxicity Assay (Cat.# G9290), CytoTox-Fluor™ Cytotoxicity Assay (Cat.# G9260)

How does trypan blue staining work?
The selective staining of dead cells with trypan blue and microscopic examination on a hemocytometer is one of the most frequently used routine methods to determine the cell number and percent viability in a population of cells. The general concept is that trypan blue is excluded from live cells but penetrates dead cells with a damaged plasma membrane.
The trypan blue staining technique is usually performed on a single sample or relatively small numbers of samples from simple experiments. The main disadvantages of this technique are: the error involved with measuring a single sample, the subjective judgment of the user to determine what is a dead cell or stained debris, inconsistency among operators, and the time and manual labor involved with measuring multiple samples.
How do I choose a fluorescent DNA-binding dye for my cytotoxicity assay?
Fluorescent DNA binding dyes are generally nonpermeable to viable cells and can be used to detect the accumulation of dead cells in culture using a multiwell plate format. The most important and practical factors to consider when choosing a dye include: the emission wavelength, selectivity for staining DNA, cell permeability, solubility at the vendor-recommended concentration, detection sensitivity and cytotoxicity. Fluorogenic DNA dyes that readily pass through the intact cell membrane and stain the nucleus of live cells should not be used for measuring dead cells.
Promega product: CellTox™ Green Cytotoxicity Assay (Cat.# G8741)
Can I measure cytotoxicity in real-time?
Yes, DNA-binding dyes can be used to measure dead cells over time, However, it is important to consider whether prolonged exposure of the cells to the dye will affect their health or responsiveness. The figure below shows the effects of three different DNA-binding dyes continuously exposed to four different cell types for 72 hours before measuring cell viability using an ATP assay.

How do lactate dehydrogenase (LDH) assays work?
The presence of dead cells that have lost membrane integrity can be detected by measuring markers that leak from the cytoplasm into the culture medium. The most common marker used for this type of assay is lactate dehydrogenase. Lactate dehydrogenase (LDH) catalyzes the conversion of pyruvate to lactate and in the process, converts NAD+ to NADH. The reducing capacity of NADH can be used to reduce a variety of substrate molecules into products that are either colored, fluorescent or luminogenic. An excess amount of lactate and NAD+ as substrates are delivered in a reagent mixture to drive LDH to generate pyruvate and NADH. The reducing power of NADH is used to convert the substrate (resazurin) into the fluorogenic product (resorufin).
Colorimetric versions of this assay chemistry have used a tetrazolium compound as the diaphorase substrate, which is converted into an intensely colored formazan product that can be measured using a spectrophotometer. Similarly, a luminometric assay can use a “pro-luciferin” substrate, which is converted into a luciferin product that is linked to a firefly luciferase reaction to generate a luminescent signal. The colorimetric version of the assay was developed decades ago and lacks detection sensitivity. In addition, because of buffer incompatibility with live cells, it requires removal of culture supernatant to a different container to perform the assay. The fluorescent assay protocol is homogeneous and more sensitive than the colorimetric version. The luminogenic version of the assay is far more sensitive than the fluorogenic version, and enables sampling of 2–5µl of culture supernatant at various times; the culture supernatant can be stored frozen for future analysis of LDH release over time.
Promega products: LDH-Glo™ Cytotoxicity Assay (Cat.# J2380), CytoTox-ONE™ Homogeneous Membrane Integrity Assay (Cat.# G7890)
Download the Assay Guidance Manual to learn more about cytotoxicity assays.
Authentication of Human Cell Lines by STR Profiling Analysis
Why is it important to authenticate human cell lines?
Cell-line misidentification and contamination has become a serious problem in biomedical research. Studies have shown that cross-contamination between cell lines occurs at frequencies from 16–35%. Confirming the exact identity of a cell line is important for interpreting experimental results, as data collected from contaminated cell lines could lead to false conclusions and irreproducible results. Therefore, it is crucial to authenticate all cell lines prior to their use.
What is STR analysis?
STR stands for “Short Tandem Repeat”, which are stretches of DNA containing core sequences of 1–6bp that are tandemly repeated up to hundreds of times scattered throughout the genome. The number of repeats at each STR loci is highly variable between different individuals. By amplifying and analyzing the unique number of repeats in various STR loci, it is possible to trace the origin of cells and tissues to a single donor.
What are the advantages of STR analysis?
STR analysis is a universally accepted method for human cell-line authentication. This method is robust in its ability to identify unique human cell lines. It is accessible and affordable through core facilities or service providers.
How is STR analysis done?
Many academic core facilities or commercial providers offer STR analysis services. STR analysis is easily performed using the PowerPlex® 18D System (Cat.# DC1802), which allows four-color fluorescent detection of eighteen STR loci, all co-amplified simultaneously in a single tube. The system is optimized for analysis of common database samples, such as direct amplification from unwashed sample collection card punches. The general process is described below:
- Spot cell suspension directly onto a sample collection card.
- Punch a disk in the center of the sample spot, and place it in the well of a reaction plate.
- Add the appropriate amount of PowerPlex® 18D 5X Master Mix and 5X Primer Pair Mix.
- Place plate in the thermal cycler, and start amplification.
Download the Assay Guidance Manual to learn more about the STR analysis protocol, how to interpret STR data and other troubleshooting tips.
BRET-Based Assays to Detect Protein:Protein Interactions in Live Cells
Why are protein:protein interactions important?
Protein:protein interactions (PPI) drive the dynamic processes in living cells. These protein targets are difficult to monitor due to the variety of amino acid lengths, binding affinities and complexity. Sensitive assays that can detect PPI in the cell are needed for high-throughput screening of compounds that may induce or inhibit these complex interactions. To gather the most accurate data, your PPI assay should be designed to reflect activity within the context of the cellular environment. Therefore, consider the cell type, transfection method, instrumentation readout and assay conditions when deciding which PPI assay will work best for your experimental needs.
What is the difference between FRET and BRET assays?
In a Förster resonance energy transfer (FRET) assay, fluorescent energy from a donor protein is transferred to an acceptor protein. When the PPI complex is formed, this energy transfer emits light detectable by flow cytometry or with a plate reader.
The bioluminescence resonance energy transfer (BRET) assay is also a proximity-based assay where energy is transferred from a luciferase donor with a fluorescent protein as the acceptor. When using optimized donor and acceptor proteins, this method has a better signal-to-background ratio and dynamic range.

How does the NanoBRET® assay work?
NanoBRET® technology uses a NanoLuc® fusion protein as the bioluminescent donor and a fluorescently labeled HaloTag® fusion protein as the acceptor. The bright, blue-shifted donor signal and red-shifted acceptor create optimal spectral overlap, increased signal and lower background compared to conventional BRET assays.
The NanoBRET® assay can be performed in any cell line that can be transfected, with some optimization. Use phenol red-free medium to avoid interference with the acceptor signal. Proteins of interest can be tagged with either NanoLuc® luciferase or HaloTag® protein on either the N or C terminus, resulting in up to eight possible constructs and eight possible combinations. Full-length proteins or protein domains can be used. The optimal ratio of donor and acceptor expression levels should be determined to reduce background and enhance the dynamic range.
To accurately perform NanoBRET® PPI Assays, you will need an instrument that can sequentially measure dual-filtered luminescence values that is equipped with appropriate filters, such as the GloMax® Discover System (Cat.# GM3000). The donor emission occurs at 460nm, and the acceptor emission occurs at 618nm. For data analysis, the BRET ratio is calculated by dividing the acceptor signal by the donor signal. The raw BRET units can then be converted to milliBRET units by multiplying the value by 1,000.

Promega products: NanoBRET® Nano-Glo® Detection System (Cat.# N1661), NanoBRET® PPI Starter Systems (Cat.# N1821)
Download the Assay Guidance Manual for more information on cell-based PPI assays.
MyGlo® Reagent Reader
Fast and simplified gold-standard luminescent cell viability assays with a personal, 96-well reagent reader.