Targeted Protein Degradation
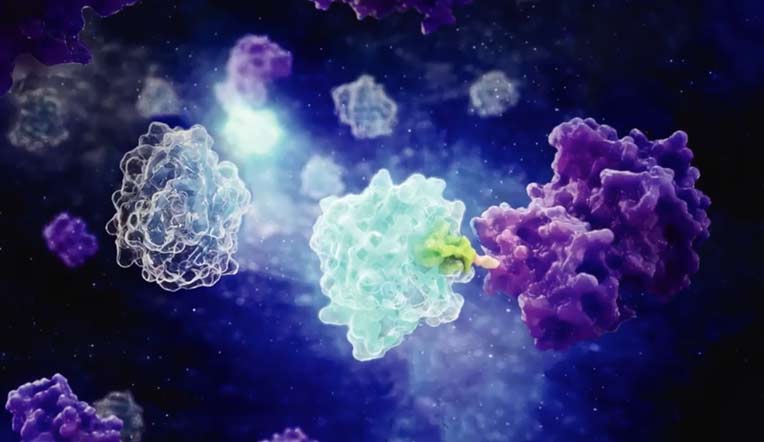
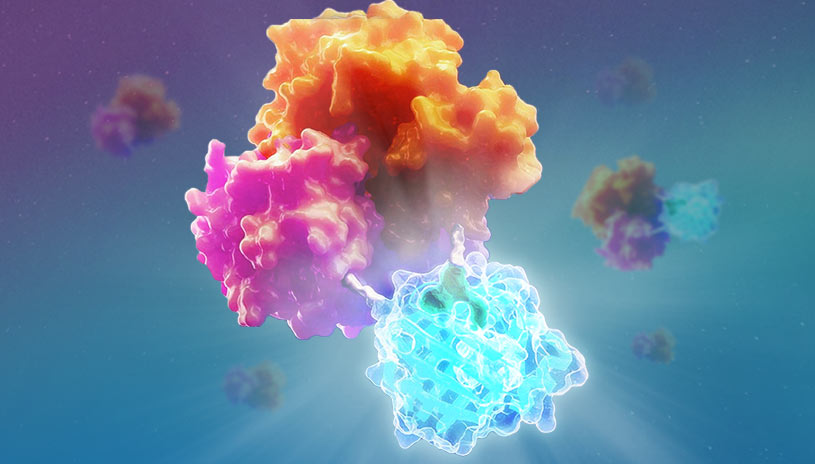
Selectively targeting proteins for removal from the cell, instead of inhibiting protein activity, is a newer modality for potential therapy. The protein is targeted for degradation using the cell’s natural ubiquitin proteasome system (UPS). Compounds such as molecular glues and proteolysis targeting chimeras (PROTACs) initiate this process by linking the target protein to an E3 ligase. The cell’s UPS does the rest.
Promega offers a comprehensive selection of CRISPR-edited cell line pools and clones to facilitate studying popular protein degradation targets, using sensitive bioluminescence technology.
Interested in more information about our targeted protein degradation (TPD) compound profiling services?

Key Questions To Consider When Developing Protein Degraders
Promega offers a portfolio of cell-based assays for use in development of effective protein degraders. These products are used to answer the following key questions:
Is My Target Degraded?
HiBiT technology enables quantitative analysis of protein degrader function. HiBiT is an 11-amino acid peptide tag which has high affinity for its complementary partner, LgBiT. Together, they form a binary luminescent protein. Upon HiBiT-LgBiT engagement, the active luciferase protein produces a very bright and highly sensitive readout correlated to the endogenous target protein level, when HiBiT is introduced at the endogenous locus using CRISPR gene editing. The HiBiT peptide tag itself can be detected with Anti-HiBiT mAb, expanding the detection options for HiBiT-tagged proteins.
Addition of compounds that elicit degradation results in loss of luminescence signal, which is highly quantitative and can be measured in real time. Cellular dose-response curves can be obtained and monitored over a 24- to 48-hour time frame, allowing for accurate determination of degradation rate, Dmax, DC50 values and protein recovery.
This approach allows rapid rank ordering of degradation against a series of different parameters, and the assay is suitable for high-throughput screening.
An illustration of HiBiT fusion:LgBiT complementation inside a cell.
Degradation kinetics of endogenous HiBiT-BRD4 following PROTAC treatment. HiBiT was inserted at the endogenous BRD4 locus in the HEK293 LgBiT Cell Line. Cells were treated with a titration of MZ1 in CO2-independent medium containing Nano-Glo® Endurazine™ substrate. A: Kinetic luminescence; B: Degradation rate; C: Dmax.
Study protein degradation in real time using CRISPR knock-in cell lines and clones.
Read the white paper.
What Is the PROTAC's Cellular Permeability and Target Affinity?
Cell-Based Approaches
When developing degrader compounds, it is important to assess their cellular permeability and affinity for target proteins and E3 ligases. The NanoBRET™ Target Engagement (TE) Assays enable the measurement of protein-small molecule binding interactions in live cells, providing quantitative determination of compound permeability, as well as target affinity and residence time.
We have successfully developed assays using NanoBRET™ TE technology for multiple target classes important in drug discovery, including kinases, histone deacetylases (HDAC) and bromodomains. Recently, the technology has been applied to E3 ligases and NanoBRET™ TE assays have been developed for CRBN, VHL, XIAP, cIAP and MDM2. The NanoBRET™ TE E3 ligase assays can be performed in live or permeabilized cells, which allows the user to assess compound affinity for the E3 ligase as well as compound permeability. Learn more about NanoBRET™ TE E3 ligase assays in this poster.
Principle of the NanoBRET™ Target Engagement Assay
Measuring cellular affinity of BET degraders targeting BRD4 using the NanoBRET™ TE Assay. Comparison of cellular binding affinity for two related PROTACs that target BRD4 (left panel) using a BRD4 NanoBRET™ TE assay. Degrader affinity for the E3 ligase CRBN was compared in live and permeabilized cells using a NanoBRET™ TE CRBN assay to assess contribution of compound permeability to measured binding affinity (right panel). The study revealed that dBET6 is more permeable than dBET1 and dBET6 has slightly higher affinity for CRBN compared to dBET1.
Currently available E3 ligase assays include: CRBN and VHL
Through our Tailored R&D Solutions, we also offer assays for XIAP, cIAP and MDM2.
Biochemical Approaches
We also offer biochemical methods to monitor binary interactions between small molecules and E3 ligases. In addition, these methods can measure interactions between small molecules and target proteins. The example shown here detects the interactions of molecular glues with the cereblon complex.
Schematic overview of a biochemical approach to measure interactions between small molecules and target proteins.
Molecular glue interactions with cereblon complex. To determine the relative affinities of molecular glues, we titrated them into a cereblon-thalidomide tracer complex. As the tracer is competed off, the luminescent signal decreases. Relative IC50 values correlate to target engagement assays in lysed cells.
To learn more about antibody-based approaches to study E3 ligase and protein target engagement with Lumit™ technology, download our poster or contact us.
Does My PROTAC Form a Ternary Complex?
Cell-Based Approaches
Formation of the E3 ternary complex (containing the target, degradation compound and E3 ligase) is a crucial step in targeted protein degradation. This step represents a critical parameter in the development and optimization of effective degrader compounds. NanoBRET™ technology is ideally suited to study ternary complex formation in a live-cell format, allowing for both endpoint or kinetic analysis.
In this assay, target protein serves as the energy donor (bioluminescence), expressed in the cell as an exogenous transient NanoLuc® fusion or an endogenously tagged HiBiT fusion in a LgBiT-expressing cell. HaloTag® fusions with von Hippel-Lindau (VHL) or cereblon (CRBN) E3 ligase components are expressed exogenously and labeled with fluorescent ligand to serve as the energy acceptor.
A schematic depiction of NanoBRET™ ternary complex formation.
Multiplexing PROTAC-induced BRD4 VHL/CRBN ternary complex formation and BRD4 protein levels using live-cell endpoint detection. Cells (BRD4/VHL assay) transfected with a 1:100 ratio of NanoLuc®-BRD4 donor plasmid to HaloTag®-VHL or HaloTag®-CRBN acceptor plasmid, pretreated with MG132 (or DMSO control), subsequently treated with 1µM MZ1 (VHL-based PROTAC) or DMSO. The NanoBRET™ ratio indicates ternary complex formation (A) and NanoLuc® luminescence indicates target protein levels (B) caused by PROTAC treatment.
Kinetically monitoring BRD4/VHL ternary complex formation following PROTAC treatment. HiBiT was inserted at the endogenous BRD4 locus in the HEK293 LgBiT Cell Line using CRISPR/Cas9 gene editing. A stable clone was transfected with HaloTag®-VHL acceptor plasmid. Cells were pretreated with MG132 prior to PROTAC treatment. NanoBRET™ signal was measured using the NanoBRET™ Nano-Glo® Kinetic Detection System to monitor ternary complex formation in real time.
Get started with ternary complex studies for VHL and CRBN.
View Starter Kits
Biochemical Approaches
We also offer biochemical methods to monitor ternary complex formation across different E3 ligases, target proteins and PROTACs. The example shown here detects PROTAC-mediated ternary complex formation with cereblon and VHL complexes.
Schematic overview of a biochemical approach to monitor ternary complex formation. With BRD3(BD2) as the target protein, PROTAC-mediated ternary complex formation can be monitored using anti-FLAG-LgBiT and anti-GST-SmBiT Lumit™ reagents.
Lumit™ PROTAC assays can determine relative potencies of different PROTACs. A: Ternary complex formation with cereblon complex + BRD3(BD2) and dBET1 or dBET6. B: Ternary complex formation with VHL complex + BRD3(BD2) and ARV-771 or MZ1. These assays demonstrate dBET6 is more potent than dBET1 and show similar potencies between ARV-771 and MZ1. In both systems, the characteristic hook effect is observed at high PROTAC concentrations.
To learn more about antibody-based approaches to monitoring ternary complex formation with Lumit™ technology, download our poster or contact us.
Does My Target Become Ubiquitinated?
Cell-Based Approaches
NanoBRET™ technology can be used to measure the kinetics of target protein ubiquitination or, in an endpoint format, for applications such as measuring compound dose-response curves.
In NanoBRET™ ubiquitination assays, the target protein serves as the energy donor and is expressed in cells as an exogenous transient NanoLuc® fusion, or an endogenously tagged HiBiT fusion in LgBiT-expressing cells. The HaloTag-Ub fusion is exogenously expressed as the energy acceptor. Live-cell NanoBRET™ assays are performed in real time using either endpoint or kinetic analysis. Similar to ternary complex formation, changes in ubiquitination are typically observed within 1-4 hours after compound addition.
Schematic illustration of a NanoBRET-ubiquitin complex.
Kinetic monitoring of BRD4 ubiquitination. HiBiT was inserted at the endogenous BRD4 locus in the HEK293 LgBiT Cell Line using CRISPR/Cas9 gene editing. A stable clone was transfected with HaloTag®-Ubiquitin acceptor plasmid. Cells were treated with 1μM MZ1 or 1μM dBET1, and the NanoBRET™ Nano-Glo® Kinetic Detection Reagent was used to measure target protein ubiquitination over time.
BRD4 ubiquitination following PROTAC treatment using a live-cell endpoint assay. HEK293 cells were transfected with NanoLuc®-BRD4 and HaloTag®-Ubiquitin plasmids at a 1:100 donor:acceptor ratio, plated in the presence of HaloTag® NanoBRET™ 618 Ligand, and treated with a serial dilution of 10μM dBET1 or MZ1 PROTAC compounds for 1 hour. For both PROTACs, a dose-dependent increase in BRET ratio was observed. Error bars represent standard deviation, n = 3.
Antibody-based assay for PROTAC® activity. HEK293 cells containing endogenously tagged HiBiT-BET family members and expressing LgBiT were treated at the indicated times with 1 μM dBET1 or MZ1 PROTACs. Cells were lysed with digitonin and incubated for 10 min with both primary polyclonal anti-Ubiquitin and Alexa-594 fluorescent secondary antibody to determine NanoBRET™ ratios. Data are represented as fold increase in NanoBRET™ values by normalizing to t = 0 time point. Variability expressed as SEM from n = 3 experiments.
Contact us to learn more about antibody approaches for studying target ubiquitination,
or get started with the NanoBRET™ Ubiquitination Starter Kit.
Biochemical Approaches
We also offer biochemical methods to monitor ubiquitination of a target protein. The example shown here detects ubiquitination of the E3 ligase Cbl-b using Lumit™ immunoassay technology.
Schematic overview of a biochemical approach to monitor target protein ubiquitination. In the presence of necessary ubiquitination components E1, E2 and ATP, the Lumit™ immunoassay can measure the interaction between biotinylated ubiquitin and GST-Cbl-b.
Measuring autoubiquitination of Cbl-b. A: A concentration-dependent increase in Cbl-b-GST ubiquitination in the presence of ATP causes increase in luminescence signal. As the process is ATP-dependent, in the absence of ATP there is a low, background signal. B: A dilution series of unlabeled ubiquitin was used to compete off the biotinylated ubiquitin and results in concentration-dependent decrease in luminescence.
What Is the Phenotypic Consequence of Target Degradation?
Temporal degradation of proteins inside a cell often elicits a much different phenotype than genetic knockouts or protein mutations. HaloPROTAC3, a fusion of a HaloTag® label and a PROTAC, is a rapid and highly effective way to understand and characterize protein degradation phenotype.
HaloPROTAC3 recruits an endogenous VHL E3 ligase component to a HaloTag® fusion protein, resulting in ubiquitination and degradation via the proteasome pathway. HaloPROTAC3 contains a degradation-inducing acylamine moiety, coupled to a chloroalkane moiety by a linker of variable length.
To study endogenous protein loss in relevant cell backgrounds, we recommend incorporating a tag into the target protein loci via CRISPR/Cas9 gene editing. Loss of protein is monitored in cells treated with HaloPROTAC3 using live-cell luminescence. HaloPROTAC3 shows fast burst loss that is sustained over time with endogenously tagged HaloTag® fusion proteins.
Schematic overview of HaloPROTAC function.

The HiBiT-BRD4 degradogram. BRD4, endogenously tagged with HiBiT and HaloTag® label, is degraded using increasing concentrations of HaloPROTAC and quantified using HiBiT luminescence.
Ready to start your degradation assays with HaloPROTAC3?
View HaloPROTAC Ligands
Endpoint Degradation Profiling
Ideal for screening large compound libraries
- Single concentration or dose response to determine DC50
- Multiple time points to assess fast (5–6 hours) and sustained (18–24 hours) degradation
- Cell viability multiplex
Kinetic Degradation Profiling
Ideal for ranking kinetic parameters of hit degraders
- Single concentration or dose response monitored for 24 hours
- Analysis of degradation rate, Dmax and Dmax50 against concentration to evaluate kinetic potency
- Endpoint cell viability multiplex
NanoBRET™ Target Engagement and Cellular Permeability
- De novo assay and tracer development
- Assessment of degrader binding affinity to target and E3
- Assessment of degrader permeability in live vs permeabilized cells
NanoBRET™ Ternary Complex Formation
- De novo assay development and testing
- Degrader profiling in endpoint or kinetic format
- Single concentration or dose response
NanoBRET™ Target Ubiquitination
- De novo assay development and testing
- Degrader profiling in endpoint or kinetic format
- Single concentration or dose response
Get started with our targeted protein degradation profiling services.
Contact us to learn more.