Selective Bioluminogenic HDAC Activity Assays for Profiling HDAC Inhibitors
Kevin R. Kupcho1, Nathan J. Evans1, Andrew L. Niles1, Thomas A. Kirkland2, and Dan F. Lazar1
1Promega Corporation, 2Promega Biosciences LLC
Publication Date: October 2014
Abstract
Although histone deacetylase (HDAC) enzymes are important drug targets, current commercial assays lack sufficient selectivity. Therefore, we developed a family of histone (lysine) deacetylase assays with better discrimination profiles that measure specific isoenzyme activities in cells, extracts or purified recombinant preparations to assess the selectivity of HDAC inhibitors. The HDAC-Glo™ Assays provide selective substrates that use extended peptide sequences and novel chemical modifications. Histone deacetylase activity is measured by adding a luminogenic prosubstrate to assay wells and detecting luminescence, which is proportional to HDAC activity, in an add, mix, read format. In addition to being isoenzyme selective, these novel substrates are cell permeable, allowing use with live cells as well as lytic assays. The HDAC-Glo™ Assays are fully compatible with fluorescent viability and cytotoxicity assays, providing flexibility for assay multiplexing to examine not only selective HDAC inhibition but also the effects of test compounds on cell health.
The Significance of HDAC Inhibitors
Histone deacetylases play critical roles in the regulation of gene transcription and cell signaling by catalyzing the deacetylation of histones and other important non-histone substrates(1). Aberrant increases in HDAC enzyme activities are implicated in a number of human diseases, including cancer, metabolic disease and neurodegeneration. HDAC enzymes are attractive pharmacological targets because they are readily inhibited by small molecules(2). In fact, several HDAC inhibitors (HDACi) have recently proceeded through or are close to FDA approval for the treatment of hematologic malignancies. However, the full promise of clinical HDACi therapy has been hampered by significant dose-limiting toxicities. These off-target effects have led to a renewed focus on basic HDAC biology and the development of isoenzyme-selective HDAC inhibitors, which could reduce or eliminate unintended toxicity. The selective HDAC-Glo™ Assays described in this article represent a new set of tools to characterize the selectivity profiles of novel HDAC inhibitors.
Chemistry and Selectivity of the HDAC-Glo Assay
In the HDAC-Glo™ reaction, HDAC enzymes remove the acetyl group on the luminogenic prosubstrate, which allows the peptide to be cleaved by a protease that liberates aminoluciferin. The free aminoluciferin product reacts with Ultra-Glo™ Recombinant Luciferase to produce a stable light signal in proportion to HDAC activity (Figure 1). Each of the three selective HDAC-Glo™ Assays uses a unique, optimized substrate. Selectivity and affinity for individual isoenzymes are summarized in Table 1.
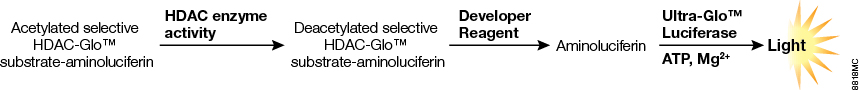
Figure 1. HDAC-Glo™ Assay chemistry. Three enzymatic events (substrate deacetylation, protease cleavage and luciferase reaction) occur in a coupled, nearly simultaneous reaction that produces luminescence proportional to HDAC activity.
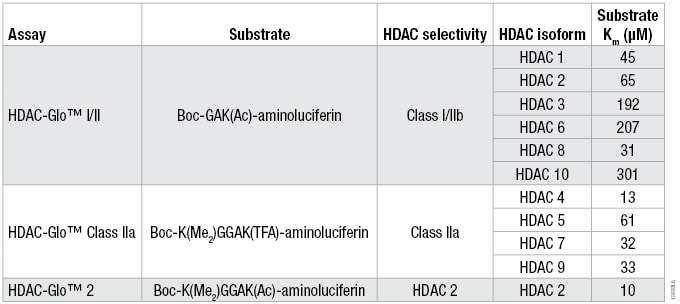
Table 1. The Optimized Substrate Sequence, Selectivity and Km for Each HDAC Isoform for the Three HDAC-Glo Assays. For substrate Km determinations, a twofold serial titration of each HDAC-Glo™ Substrate was performed in the corresponding assay buffer. Two separate HDAC recombinant enzyme concentrations (n = 3 for each) and no-enzyme controls (n = 2) were added to the diluted substrate to start the coupled enzymatic reaction. Luminescence was measured and the background luminescence (no-enzyme control) for each substrate concentration was subtracted for the two separate HDAC enzyme concentrations. The data were plotted and Km determined using a one-site binding, hyperbolic fit.
Biochemical Isoenzyme Selectivity Panels
To characterize the selectivity of the three HDAC-Glo™ Assays, recombinant HDAC isoenzyme selectivity panels were performed for all three assays with 11 recombinant HDAC enzymes. As shown in Figure 2, the HDAC-Glo™ I/II Assay selectively measures activity from class I and IIb HDAC isoforms (HDACs 1, 2, 3, 6, 8 and 10). The HDAC-Glo™ Class IIa Assay selectively measures activity from class IIa HDAC isoforms (HDACs 4, 5, 7 and 9). Finally, the HDAC-Glo™ 2 Assay selectively measures activity from HDAC isoform 2 (HDAC 2).
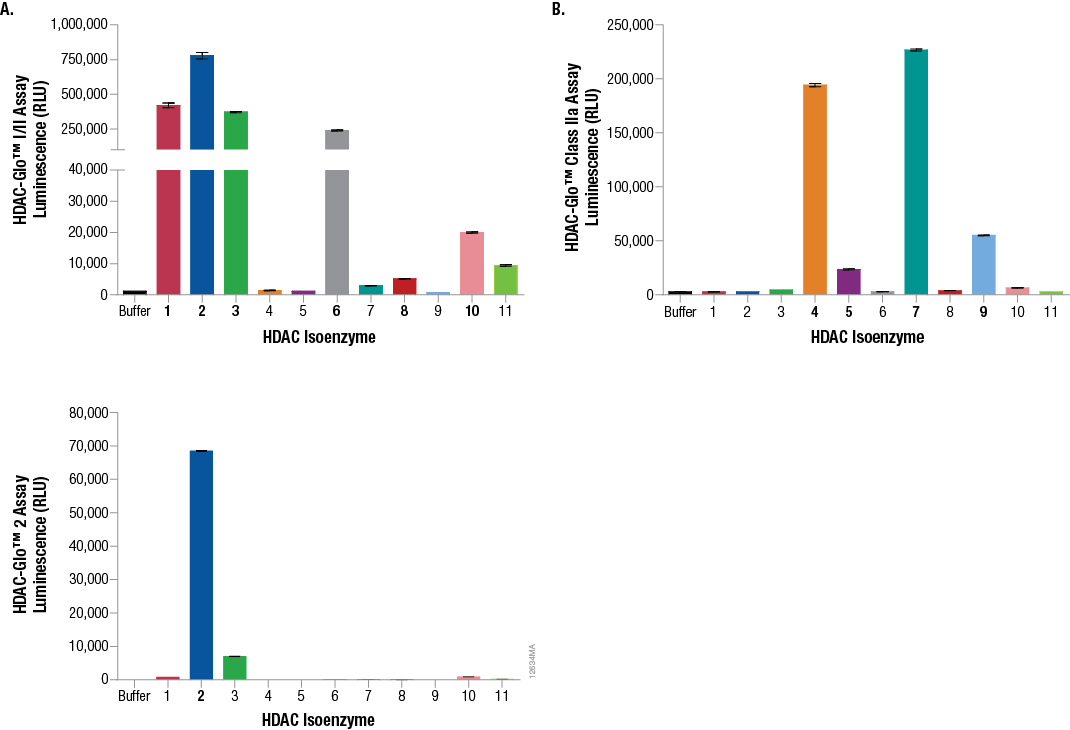
Figure 2. Recombinant HDAC isoenzyme selectivity panels for the HDAC-Glo™ I/II Assay, HDAC-Glo™ Class IIa Assay and HDAC-Glo™ 2 Assay. For all assays, each recombinant HDAC enzyme was diluted to equal molar equivalents (1,000pM for the HDAC-Glo™ I/II Assay [Panel A], 25pM for the HDAC-Glo™ Class IIa Assay [Panel B], and 250pM for the HDAC-Glo™ 2 Assay [Panel C]) in the appropriate corresponding assay buffer. For each enzyme (n = 8 replicates), 100µl volumes were transferred to a white 96-well assay plate and an equal volume (100µl) of the appropriate corresponding HDAC-Glo™ final detection reagent was added to all wells and luminescence measured at signal steady state.
Broad Linearity and Large Dynamic Range of Selective HDAC-Glo Assays
To examine the linear and dynamic ranges for the three selective HDAC-Glo™ Assays, recombinant HDAC isoenzyme titrations or cell titrations were performed. As shown in Figure 3, all three HDAC-Glo™ Assays produce broad linear responses (2–3 orders of magnitude) with large dynamic ranges in both a biochemical and cell-based (live cell and lytic) assay format. This means using less enzyme or fewer cells while still producing a large dynamic range, and translates into increased sensitivity to any effects on HDAC activity caused by HDAC inhibitors.
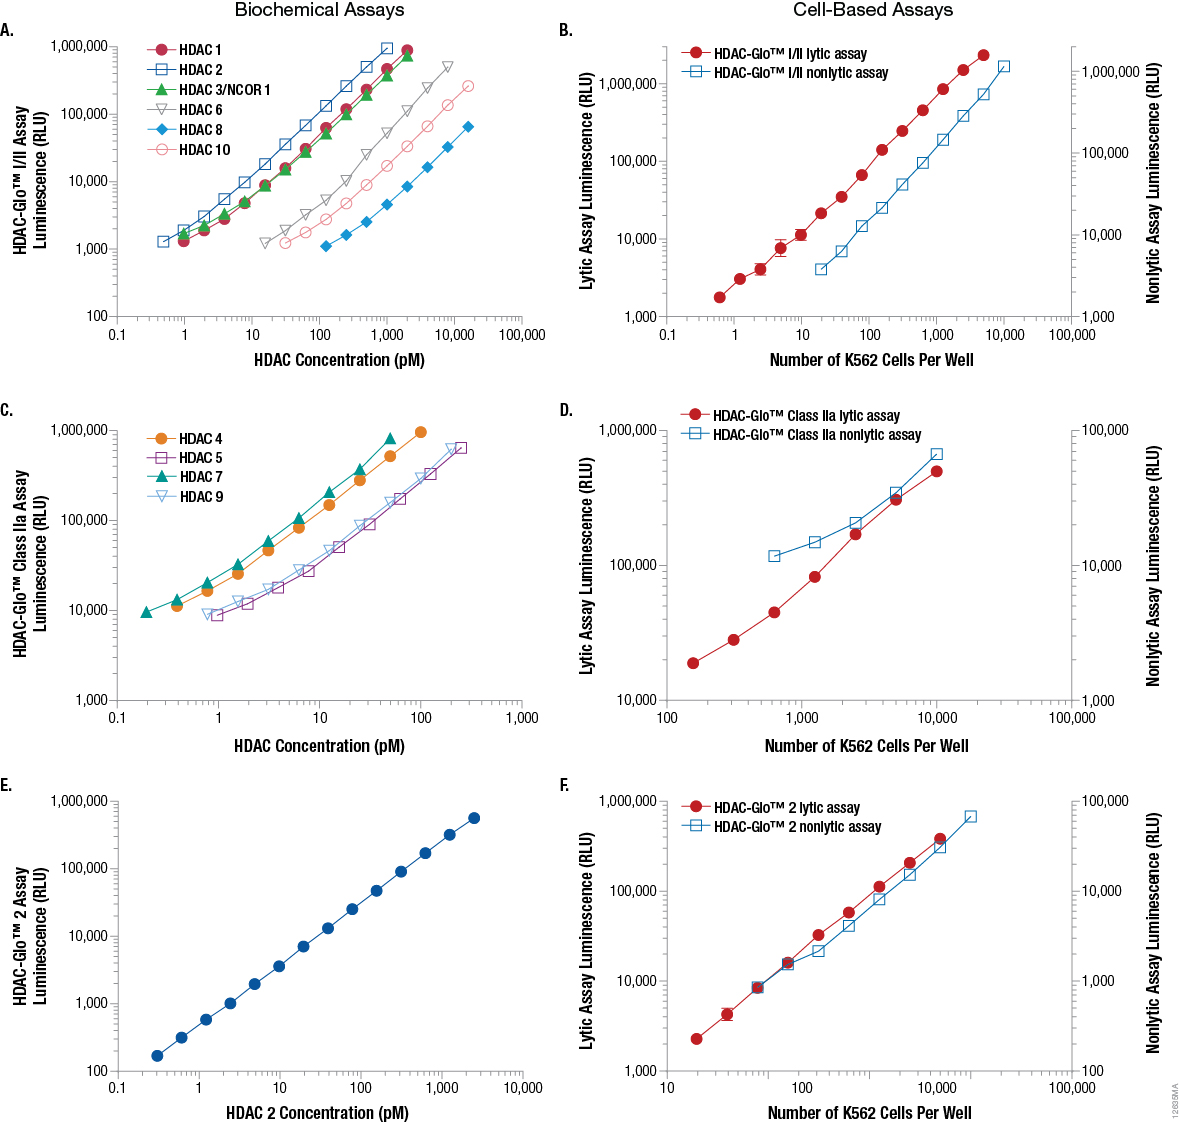
Figure 3. Recombinant HDAC enzyme titrations and K562 cell titrations using the HDAC-Glo™ I/II Assay, HDAC-Glo™ Class IIa Assay and HDAC-Glo™ 2 Assay. For the biochemical assays (Panels A, C, E), 10µl of a twofold serial dilution series of recombinant HDAC enzyme in the appropriate HDAC-Glo™ Assay buffer was dispensed into a white 384-well assay plate. Then 10µl of the appropriate HDAC-Glo™ Reagent or Final Detection Reagent was added to each well and luminescence measured. For the cell-based assays (Panels B, D, F), 20µl of twofold serial dilution of K562 cells in serum-free RPMI-1640 medium was added to a white 384-well assay plate. Then 20µl of the appropriate corresponding HDAC-Glo™ Reagent or Final Detection Reagent (with or without lytic agent) was added to each well, and luminescence measured. Panels A and B. HDAC-Glo™ I/II Assay. Panels C and D. HDAC-Glo™ Class IIa Assay. Panels E and F. HDAC-Glo™ 2 Assay.
Simplified Cell-Based Profiling of HDAC Inhibitor Selectivity and Potency
Demonstrating HDAC inhibitor selectivity and potency in a biochemical format is a fairly straightforward and simple endeavor. However, conducting these experiments using a live-cell-based system has proven problematic with traditional methods. To demonstrate that the selective HDAC-Glo™ Assays can be used to investigate HDAC inhibitor selectivity and potency in a live-cell-based assay, we used two well-characterized selective HDAC inhibitors. Suberanilohydroxamic acid (SAHA) selectively inhibits HDAC class I and class IIb isoenzymes(3) while TMP269 provides selective inhibition of HDAC class IIa isoenzymes(4). As shown in Figure 4, Panel A, when SAHA was titrated to determine potency using live K562 cells, the compound showed the expected strong inhibition and IC50 value against the HDAC-Glo™ I/II assay (class I/IIb selective) and was significantly less potent against the HDAC-Glo™ Class IIa assay (class IIa selective). In contrast, as shown in Figure 4, Panel B, when TMP269 was titrated to determine potency using live K562 cells, the compound strongly inhibited HDAC-Glo™ Class IIa assay (class IIa selective) and matched the expected IC50 value while observing no inhibition against the HDAC-Glo™ I/II assay (class I/IIb selective). These data reinforce the benefit of combining selective HDAC-Glo™ Assays to obtain more conclusive results when defining HDAC inhibitor selectivity in live cells.
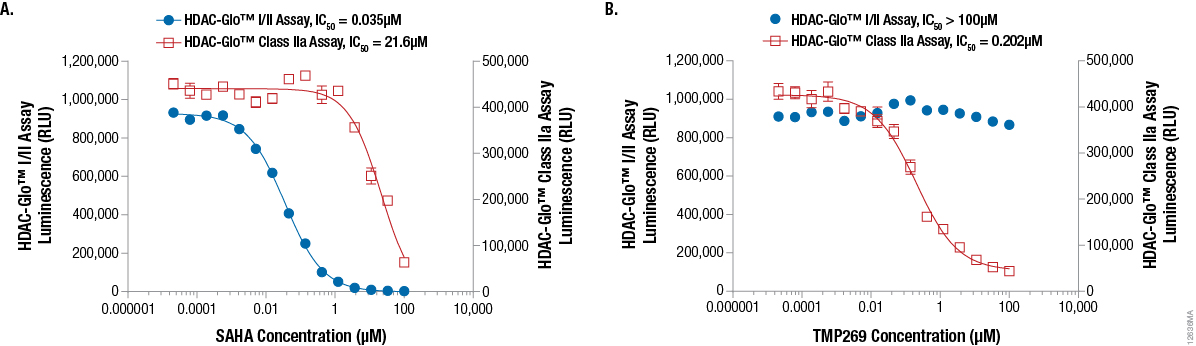
Figure 4. Example inhibitor potency data demonstrating cell-based isoenzyme selectivity in K562 cells using the HDAC-Glo™ I/II Assay or the HDAC-Glo™ Class IIa Assay. This example assay tested two HDAC-Glo™ isoenzyme assays with SAHA, a selective class I/IIb HDAC inhibitor (Panel A) or TMP269, a selective class IIa HDAC inhibitor (Panel B). Ten microliters of a 15-point threefold serial dilution of 2X compound was added to a white 384-well assay plate followed by 10µl of K562 cells in serum-free RPMI-1640 media (final density of 2,500 K562 cells/well). Following a 45-minute pre-incubation of cells and inhibitor at room temperature, an equal volume (20µl) of HDAC-Glo™ I/II Reagent or HDAC-Glo™ Class IIa Final Detection Reagent (both with 1% Triton® X-100 for lytic assay) was added to the appropriate wells and luminescence was measured.
Real-Time Assessment of Cell Permeability and Inhibitor Association Rates for Compounds in a Live-Cell Format
While inhibitor selectivity and potency profiles continue to be key criteria for advancing compounds during HDACi development, recent reports suggest(5) (6) that association and disassociation kinetics also affect the pharmacological utility of a drug. That is, the rate at which a drug diffuses or is transported into a cell and engages and disengages from its target (residence time) may influence functional potency and off-target effects. Because the HDAC-Glo™ Assays use cell-permeable substrates and produce a stable and proportional luminescent, real-time report of HDAC activity, we were able to examine these parameters.
We adapted the standard protocol by adding HDAC-Glo™ Reagents to live cells and incubating until a stable luminescent signal was achieved. Next, we applied serial dilutions of either SAHA or mocetinostat, which are known to have differential binding kinetics. Luminescence was measured in kinetic mode. As shown in Figure 5, Panel A, when measuring the inhibitory concentration (IC50) of mocetinostat in real time using live K562 cells and the selective HDAC-Glo™ 2 Assay, the test agent became more potent as a function of treatment time. These results suggest either a slow target engagement rate with its HDAC targets or poor cell permeability. In contrast, SAHA IC50 values did not change significantly over time (data not shown). This data indicates a fast association rate of SAHA with its target HDAC activities (occurring prior to the first luminescent measurement) and exceptional permeability. When the respective IC50 values are replotted versus time (Figure 5, Panel B), it is evident that mocetinostat has a much slower onset of action than SAHA, as expected. To address potential poor compound permeability, the same experiments were performed in a biochemical assay format using purified recombinant HDAC 2. The same association data profiles were observed (data not shown). This leads to the conclusion that the observed differences in association rates between the two compounds is most likely due to differences in target engagement rates and not cell permeability differences.
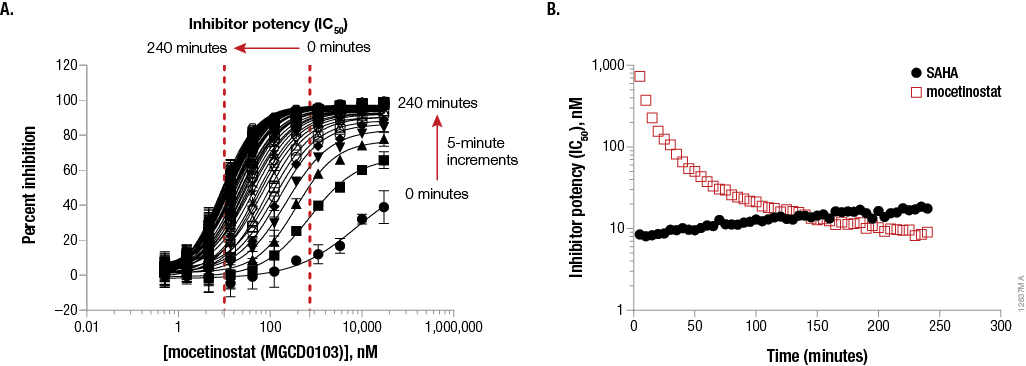
Figure 5. Example data to demonstrate real-time kinetic inhibitor potency determinations in live K562 cells using the HDAC-Glo™ 2 Assay (nonlytic) to assess differences in compound cell permeability and active-site engagement. Panel A. K562 cells in serum-free media (90µl) were dispensed to a white 96-well assay plate to a final density of 10,000 cells/well. Then 100µl of HDAC-Glo™ 2 Final Detection Reagent was added to initiate the HDAC reaction. After incubating for 20 minutes to reach enzyme steady-state, 10µl of 20X mocetinostat (selective HDAC 1, 2 and 3 inhibitor) was added and luminescence was measured every 5 minutes for 4 hours. Panel B. The same experiment was done for SAHA and the data for both compounds was re-plotted as IC50 versus time.
Mechanistic Cytotoxicity: Phenotypic Consequences of Selective HDAC Inhibition
Although measuring HDAC inhibitor potency and selectivity is important, it is also critical to measure the phenotypic consequences of selective HDAC inhibition. To do this, we multiplexed the luminescent HDAC-Glo™ 2 Assay with the fluorescent CellTox™ Green Cytotoxicity Assay. This probe is cell impermeant, nontoxic and selectively binds to DNA from dead cells(7). As shown in Figure 6, Panel A, SAHA (class I/IIb HDAC inhibitor) produces a dose-dependent decrease in HDAC-Glo™ 2 luminescence as well as an increase in CellTox™ Green fluorescence. This indicates that HDAC class I/IIb inhibition is sufficient to produce cytotoxicity in K562 cells exposed to SAHA. In contrast, TMP269 (class IIa HDAC inhibitor) reduced the HDAC-Glo™ Class IIa Assay luminescence with no increase in CellTox™ Green fluorescence (Figure 6, Panel B). These results are consistent with use of TMP269 as an immune modulator.
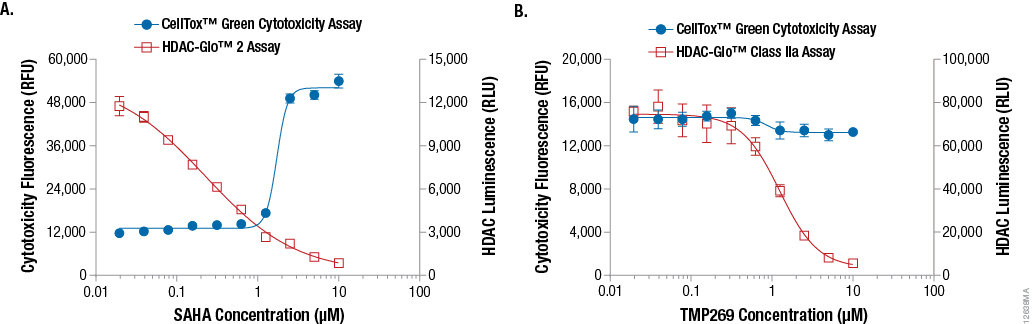
Figure 6. Example data demonstrating the HDAC-Glo™ Assays multiplexed with the CellTox™ Green Cytotoxicity Assay. K562 cells were exposed to SAHA (Panel A), a selective class I/IIb HDAC inhibitor, or TMP269 (Panel B), a selective class IIa HDAC inhibitor, for 72 hours in the presence of CellTox™ Green Dye, a real-time fluorescent cytotoxicity probe. After collecting fluorescence data, HDAC 2 activity (Panel A) or HDAC Class IIa activity (Panel B) was determined by adding an equal volume of HDAC-Glo™ 2 Assay Final Detection Reagent (Panel A) or HDAC-Glo™ Class IIa Assay Final Detection Reagent (Panel B) in a multiplexed, same-well format and measuring luminescence. Note: An increase in fluorescence with the CellTox™ Green Dye indicates increasing cytotoxicity.
Summary
The selective HDAC-Glo™ Assays offer significant advantages over existing plate-based methods. HDAC-Glo™ I/II and HDAC-Glo™ Class IIa Assays deliver isofamily selectivity, and HDAC-Glo™ 2 Assay delivers isoenzyme selectivity, for targeting and profiling isoenzyme-selective HDAC inhibitors. These versatile assays can be used in either biochemical or cell-based formats and are easy-to-use because of their add-mix-read, single reagent format. The assays are easily scalable into high-density plate formats and produce a steady luminescent signal. Because the assays produce broad linear responses (two to three orders of magnitude) with large dynamic ranges, the selective HDAC-Glo™ Assays offer enhanced sensitivity compared to current fluorescent-based formats. While these assays produce IC50 values that are comparable to published data(1) (3) (4) when using well-characterized HDAC inhibitors, an additional benefit is the ability to assess differences in cell permeability and target association rates in live cells. Finally, the ability to multiplex the selective HDAC-Glo™ assays with fluorescent cytotoxicity assays (e.g., CellTox™ Green Cytotoxicity Assay) allows measurement of selective HDAC inhibition as well as the cytotoxic consequences of inhibitor activity on cell health.
References
- Hess-Stumpp, H. et al. (2007) MS-275, a potent orally available inhibitor of histone deacetylases--the development of an anticancer agent. Int. J. Biochem. and Cell Bio. 39, 1388–1405.
- Wagner, J.M. et al. (2010) Histone deacetylase (HDAC) inhibitors in recent clinical trials for cancer therapy. Clin. Epigenetics 1, 117–36.
- Bradner, J.E. et al. (2010) Chemical phylogenetics of histone deacetylases. Nat. Chem. Biol. 6, 238–43.
- Lobera, M. et al. (2013) Selective class IIa histone deacetylase inhibition via a nonchelating zinc-binding group. Nat. Chem. Biol. 9, 319–25.
- Copeland, R.A., Pompliano, D.L. and Meek, T.D. (2006) Drug-target residence time and its implications for lead optimization. Nat. Rev. Drug Discov. 5, 730–9.
- Lauffer, B.E. et al. (2013) Histone deacetylase (HDAC) inhibitor kinetic rate constants correlate with cellular histone acetylation but not transcription and cell viability. J. Biol. Chem. 288, 26926–43.
- Niles A et al. (2012) Measuring cytotoxicity in real time with a highly stable green dye. Promega PubHub.
Learn more about the HDAC-Glo™ I/II Assays