Methods of RNA Quality Assessment
Doug Wieczorek, Laurence Delauriere and Trista Schagat
Promega Corporation
Abstract
RNA is extremely susceptible to degradation due to the ubiquitous presence of RNases in the environment. Successful RNA analysis involves not only careful handling during purification but also selecting the proper quantification and analysis methods for the type of sample and applications involved. In this article, we discuss the most common methods for RNA quantification and analysis. We include details about the appropriate application for each method as well as highlighting advantages and disadvantages of each method.
Introduction
High-quality RNA is required for many downstream applications. Quality requirements can be very different, depending on the downstream application, and RNA unsuitable for one application may provide perfectly acceptable results in another. For instance, microarray experiments may require RNA samples with specific concentration, purity and integrity values, while qPCR-based assays may accept samples with lower quality scores because the amplicons are small. Due to the high costs of many of these assays, RNA samples need to be analyzed properly to prevent failure downstream and eliminate costs associated with repeating the analysis. RNA is extremely susceptible to degradation due to the ubiquitous presence of RNases in the environment. For this reason, great care and consideration is required when working with RNA. The key to using RNA successfully in downstream applications involves not only careful handling during RNA purification but also selecting the proper quantification and analysis methods for the type of sample and applications involved. Correctly interpreting data obtained from quantification and quality control analysis is essential. In this article, we will discuss the most common methods for RNA quantification and analysis. A general overview of each method will be provided, including the information that each method yields, and more importantly, what each method does not provide. Advantages and disadvantages of the various other methods are discussed.
Absorbance
Ultraviolet (UV) absorbance can be used to measure DNA, RNA or protein concentration. For nucleic acids, the three main wavelengths of interest are 260nm, 280nm and 230nm. Absorbance at 260nm is used to measure the amount of nucleic acid present in the sample. Concentration can be calculated using the 260nm reading and a conversion factor based on the extinction coefficient for each nucleic acid (A260 of 1.0 = 50µg/ml double-stranded DNA, 40µg/ml for RNA and 33µg/ml for single-stranded DNA). Aromatic amino acids absorb light at 280nm, so absorbance measurements at that wavelength are used to estimate the amount of protein in the sample. Measurements at 230nm are used to determine the amount of other contaminants that may be present in the samples, such as guanidine thiocyanate—common in nucleic acid purification kits (Figure 1). In addition, an absorbance reading at 320nm can be taken to detect any light-scattering components in the sample. The 320nm reading is subtracted from the 260nm, 280nm and 230nm values as background.
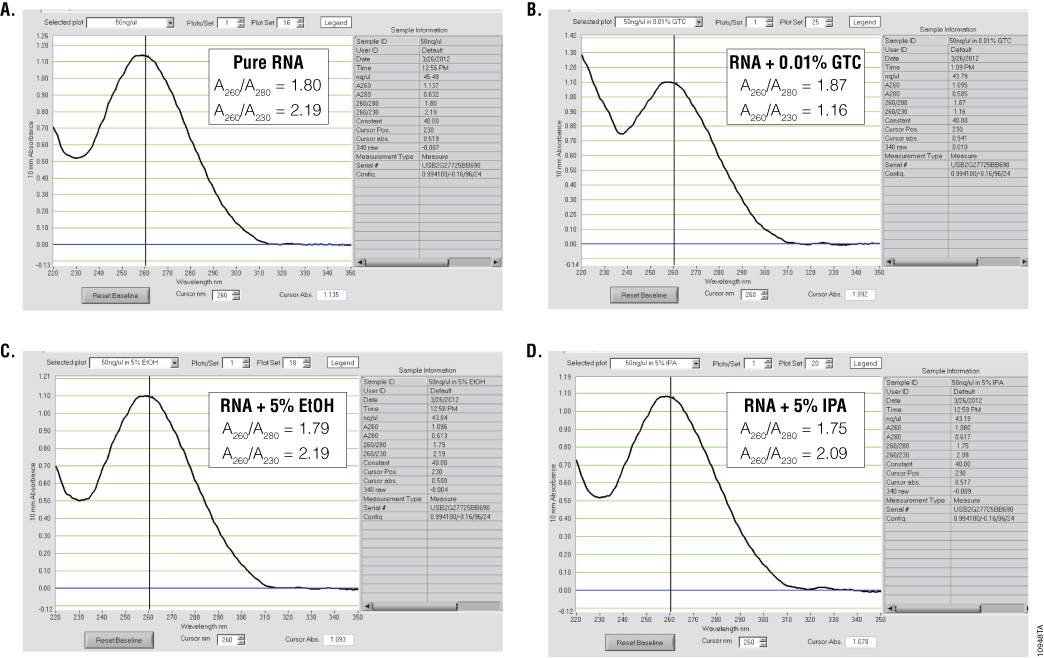
To estimate nucleic acid purity, the ratio of the absorbance contributed by the nucleic acid to the absorbance of the contaminants is calculated. Acceptable ratios for purity will vary with the downstream application. However, typical requirements for A260/A280 ratios are 1.8–2.2, while requirements for A260/A230 ratios are generally >1.7 (Figure 1). While some assays or applications have recommended A260/A230 ratios, this ratio does not always predict success in downstream applications. One thing to note is that the A230 is often constant for nucleic acid purified using a specific kit, while the amount of nucleic acid can vary, depending on the sample source. Thus, the A260/A230 ratio will often decrease when small amounts of nucleic acids are isolated.
Spectrophotometers used to measure absorbance typically use cuvettes to analyze samples and often require up to 1ml or more of sample volume. However, instruments such as the NanoDrop® (Thermo Scientific) and NanoVue™ (GE Healthcare) spectrophotometers were designed to specifically measure absorbance using small sample volumes. The NanoDrop® instrument can measure absorbance in the wavelength range of 190–840nm and requires only 0.5–2µl of sample for an accurate measurement. For RNA, the NanoDrop® instrument detects a minimum of 2ng/µl up to 12,000ng/µl. Because of the wide detection range and small sample volume, samples typically do not need to be diluted before measurement, and a single measurement can be taken in less than 30 seconds. Unlike other quantification methods, no other reagents or accessories are required for analysis.
The main disadvantages to using absorbance are the lack of specificity as well as the lack of sensitivity to quantitate low-level samples. All nucleic acids (dsDNA, RNA and ssDNA) absorb at 260nm, and the method is not capable of distinguishing between the various forms of nucleic acid. While the A260/A230 ratio can be used to estimate nucleic acid purity, the amount of genomic DNA present in an RNA preparation cannot be determined by absorbance. Also, if significant amounts of contaminants that absorb around 260nm are present in a sample, the contaminants themselves can contribute to the absorbance value, resulting in an overestimation of nucleic acid concentration. If RNA samples are degraded due to the nature of the sample or sample handling and preparation, changes in RNA integrity are not reflected in the measurement because single nucleotides also will contribute to the 260nm reading.
Fluorescent Dye-Based Quantification
An alternative to UV absorbance to quantify nucleic acid involves the use of fluorescent dyes that bind to dsDNA, RNA and ssDNA. In this method, a nucleic acid sample along with a series of standards of known concentrations are incubated with the fluorescent dye. The dye binds to the nucleic acid and undergoes a conformational change, resulting in increased fluorescence at a wavelength specific to the dye being used. Fluorescence is measured, and a standard curve (for plate readers) or reference standard (for handheld fluorometers) is created by plotting fluorescence against nucleic acid concentrations of the known standards. The fluorescence of the unknown sample then is converted to a nucleic acid concentration using the linear regression equation that best describes the standard curve. Samples can be analyzed in 0.2ml PCR tubes if using handheld readers such as the Quantus™ Fluorometer or in 96-well plates if using microplate readers such as the GloMax® Discover System.
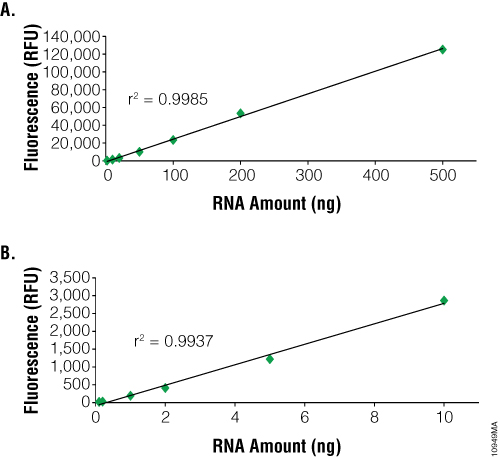
The main advantage to using fluorescent dye-based methods for RNA quantification is sensitivity. The NanoDrop® spectrophotometer can detect as little as 2ng/µl. In contrast, dye-based methods such as the QuantiFluor™ RNA System can detect as little as 100pg (i.e., 100µl sample in a PCR tube or 96-well plate = 1pg/µl). However, dye-based methods can only quantitate up to 2.5ng/µl compared to 12,000ng/µl for the NanoDrop® instrument (Figure 2). RNA purified from samples with high nucleic acid content may need to be diluted prior to use with dye-based methods. Samples of 1–100µl can be measured, depending on RNA concentration, to conserve precious samples for more important downstream applications. Dye-based assays are relatively fast and can be automated. Samples are combined with the dye and briefly incubated. Each measurement requires only a few seconds.
One disadvantage to using fluorescent dye-based methods is the lack of specificity with the caveat that some fluorescence dyes offer higher template specificity than others. One method to increase specificity is to incubate the sample with DNase to remove contaminating DNA, improving template specificity when compared to absorbance-based methods. The dyes used by the QuantiFluor™ RNA System and Quant-iT™ RiboGreen® RNA Reagent are not specific for RNA and will bind to DNA as well. The presence of DNA in an RNA sample may result in an overestimation of nucleic acid concentration. To determine the actual RNA concentration, we recommend a DNase treatment of RNA samples prior to measurement. One exception is the Quant-iT™ RNA Assay, which does use an RNA-specific dye. However, the assay is significantly less sensitive than other assays, with a limit of detection of 250pg/µl if 20µl of sample is used or 5ng/µl if 1µl of sample is used. Thus, the amount of RNA needed for measurement must be greater than 5ng for the Quant-iT™ RNA Assay.
No purity or integrity information is provided with dye-based quantification, although separate dye-based systems are available to quantify the amount of protein present in the sample. Also, the user must generate a standard curve or reference standard appropriate for the expected nucleic acid concentrations of the unknown samples. Since the sample concentration is unknown, multiple standard curves may need to be created (i.e., high-concentration or low-concentration) for accurate quantitation. Similar to many other laboratory chemicals, these fluorescent dyes are potentially hazardous, and proper handling and disposal of the reagents are required.
Agarose and Acrylamide Gel Electrophoresis
One of the most common methods of DNA and RNA analysis is agarose or acrylamide gel electrophoresis. Samples are loaded into precast gels, and as an electrical current is passed through the gel, nucleic acid fragments are separated on the basis of size. Larger fragments move more slowly through the gel matrix, while smaller fragments move more quickly. The gels containing the separated fragments are stained with a fluorescent dye that bind nucleic acids, such as ethidium bromide, SYBR® Green or SYBR® Gold but are not specific to RNA. The separated fragments then can be visualized by excitation of the fluorescent dye bound to the nucleic acid.
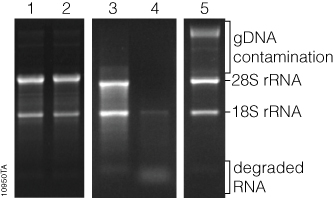
RNA concentration can be qualitatively measured by comparing the relative fluorescence intensity of the RNA bands to that of known RNA standards, or quantitatively by sophisticated equipment that uses software to analyze an image of the gel, known as gel densitometry. General information about RNA integrity can be obtained by observing the staining intensity of the major ribosomal RNA (rRNA) bands and any degradation products. For mammalian rRNA, a 28S:18S rRNA ratio of 2:1 is generally representative of good-quality RNA. Genomic DNA contamination of RNA samples can be visualized in the sample, as genomic DNA typically runs much slower through the gel matrix than RNA (Figure 3).
While the cost of analyzing RNA by gel electrophoresis is relatively low, analysis requires a significant amount of handling and hands-on time. Typically, at least a few nanograms of RNA are required for visualization, although the minimum mass that can be detected will vary by stain. Compared to the sensitivity of ethidium bromide staining, the sensitivities of SYBR® Green II and SYBR® Gold dyes in a denaturing agarose gel have been shown to be 2.4X and 7.9X, respectively (1) . Finally, since these fluorescent stains bind to nucleic acids, they are potential carcinogens. Great care must be taken while handling the stain, stained gels and any equipment that comes in contact with the stain. However, SYBR® Green II and SYBR® Gold dyes are viewed as safer alternatives to ethidium bromide (2) . Proper cleaning and disposal of materials are required.
There are other limitations to using gel electrophoresis for RNA analysis. The method cannot determine whether the RNA sample contains amplification inhibitors. If RNA is purified from formalin-fixed paraffin-embedded (FFPE) samples, the 28S:18S ratio is not useful for assessing RNA quality.
2100 Bioanalyzer
The 2100 Bioanalyzer (Agilent Technologies) uses microfluidics to analyze DNA, RNA, protein and cells using sample-specific chips. This system is essentially a miniaturized version of agarose and acrylamide gels used to separate nucleic acid and proteins for analysis. Samples are combined with a fluorescent dye and injected into wells in the chip. The samples move through a gel matrix in the microchannels and are separated by electrophoresis. The samples then are detected by fluorescence, and electropherograms and gel-like images are created by the data analysis software for sizing and quantification. Only 1µl of sample is required, 11–12 samples can be run on the same chip, and analysis is complete in 30–40 minutes.
The 2100 Bioanalyzer uses kits that are specific for the samples of interest. For dsDNA analysis, kits are available for dsDNA ranging from 25bp to 12,000bp in length and for low-concentration samples. For RNA analysis, kits are available for small RNA and microRNAs (Small RNA Kit) as well as total RNA and mRNAs in the range of 5–500ng/µl (RNA 6000 Nano Kit) and 50–5,000pg/µl (RNA 6000 Pico Kit).
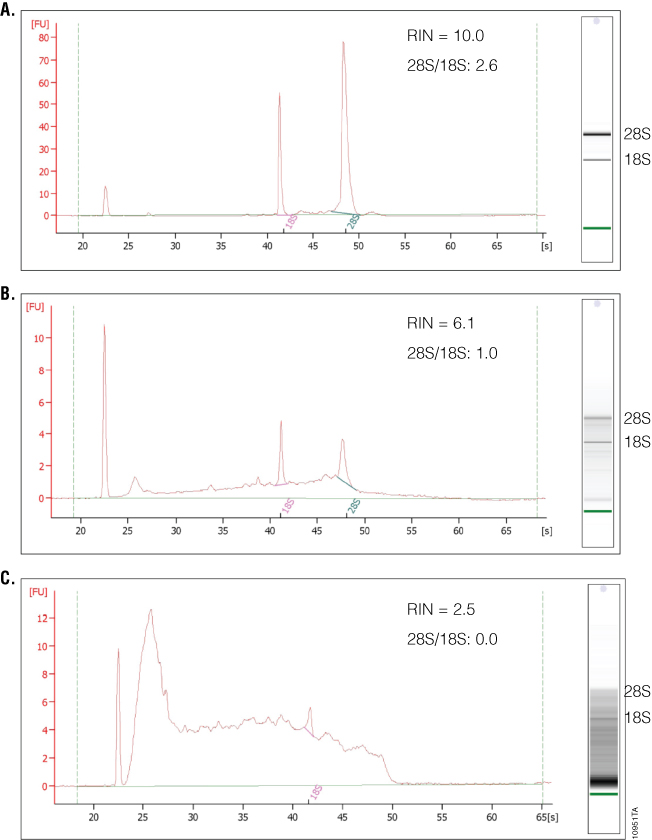
What separates the 2100 Bioanalyzer from other RNA analysis methods is the ability to measure RNA integrity, which is displayed as the RNA Integrity Number (RIN). To determine the RIN, the instrument software uses an algorithm that takes into account the entire electrophoretic trace of the RNA, not just the ratio of 28S and 18S rRNAs. The RIN scale ranges from 0 to 10, with 10 indicating maximum RNA integrity. The ratio of 28S and 18S rRNA peaks also is given. As RNA degradation becomes more apparent, peak heights for the 28S and 18S rRNA peaks decrease, while smaller or degraded RNA peaks become more prominent. The 28S and 18S peaks will hardly be visible in RNA samples with significant degradation (Figure 4). The software also estimates RNA concentration by comparing peak areas of a ladder with RNA fragments of known concentration and peak areas of the unknown samples. In addition, a gel-like image is provided for visualizing fragment sizing and distribution as well as a visual representation of the RNA ladder. An added advantage to the 2100 Bioanalyzer is the ability to resolve small RNAs and microRNAs, which are becoming increasingly popular targets of study. One disadvantage is the lack of information on sample purity. If information about the amount of DNA or protein contamination is required, separate samples on specific DNA or protein chips would need to be run and analyzed. Finally, while the 2100 Bioanalyzer has some unique and powerful features, instrumentation, reagent and chip costs may be prohibitive to some labs.
Real-Time Quantitative PCR and RT-PCR
Quantitative PCR (qPCR) is an increasingly popular method of nucleic acid quantification. With traditional endpoint PCR, the amount of amplified product is typically determined only after the final amplification cycle is completed. This is usually after the plateau phase of amplification, where reaction components have become depleted, and thus this estimate may not be a true representation of the amount of starting material. With qPCR, the amount of amplified product is measured at the end of each cycle of amplification or in real time during the exponential phase of amplification. After each cycle of amplification, amplification product accumulates and eventually reaches a threshold, where it can be detected above background. This point, or cycle, in the reaction is referred to as the Quantification Cycle, or Cq, and is often set at a signal that is ten standard deviations above the background signal.
The amount of amplified product is measured by fluorescence, either through the use of DNA-binding fluorescent dyes (e.g., BRYT Green®, SYBR® Green), fluorescently labeled DNA probes (e.g., TaqMan® Assays, Molecular Beacons), or fluorescently labeled DNA primers (e.g., Plexor® Systems). Quantification can be relative, such that the quantification cycle value (Cq) of the gene of interest is compared to that of a reference gene, or absolute, such that a standard of known DNA amount is analyzed along with the samples of interest to obtain a defined amount of DNA in the starting material. Theoretically, each cycle results in the doubling of the product (at 100% efficiency), meaning a difference of 1 Cq corresponds to a twofold difference in starting material, while a difference of 3.3 Cq corresponds to a tenfold difference in starting material.
RT-qPCR can be used to measure the amount of a specific RNA target in a sample by incorporating a reverse transcription (RT) step followed by qPCR. Primer design is crucial for successful RT-qPCR. The use of RNA-specific primers that flank an intron of the target sequence are recommended for RNA (cDNA) detection, whereas primers within an intron can be used to detect DNA contamination in an RNA sample. In addition, control reactions in which no reverse transcriptase is added to the RT reaction are recommended for analyzing DNA contamination. RT-qPCR is extremely sensitive, and under optimal reaction conditions, a single copy of a target sequence can be detected. Amplicon sizes are typically 100–200bp to ensure good amplification efficiency. Primers that generate amplicons of various lengths can be used to determine RNA integrity. As RNA becomes increasingly degraded, it becomes more difficult to successfully and consistently amplify larger amplicons. Thus, for degraded RNA, smaller amplicon sizes are recommended.
Labeling separate primer sets with different fluorophores allows the user to analyze multiple targets in a single reaction and analyze samples for the presence of PCR inhibitors. To detect PCR inhibitors in the RNA sample, the samples are added to a reaction that contains a control DNA template and primers. Any delay in Cq value compared to the Cq value of the control DNA alone may indicate the presence of PCR contaminants that could affect downstream applications (e.g., Plexor® or TaqMan® inhibitor assay). While often the downstream application for RNA analysis, RT-qPCR can be used to qualify RNA for other downstream applications as well. One disadvantage to qPCR and RT-qPCR is cost because real-time analysis often requires the use of specialized reagents and instrumentation.
Case Study
RNA was extracted from mouse liver FFPE sections in triplicate using two RNA purification kits. Purified RNA was quantified using three methods (Table 1).
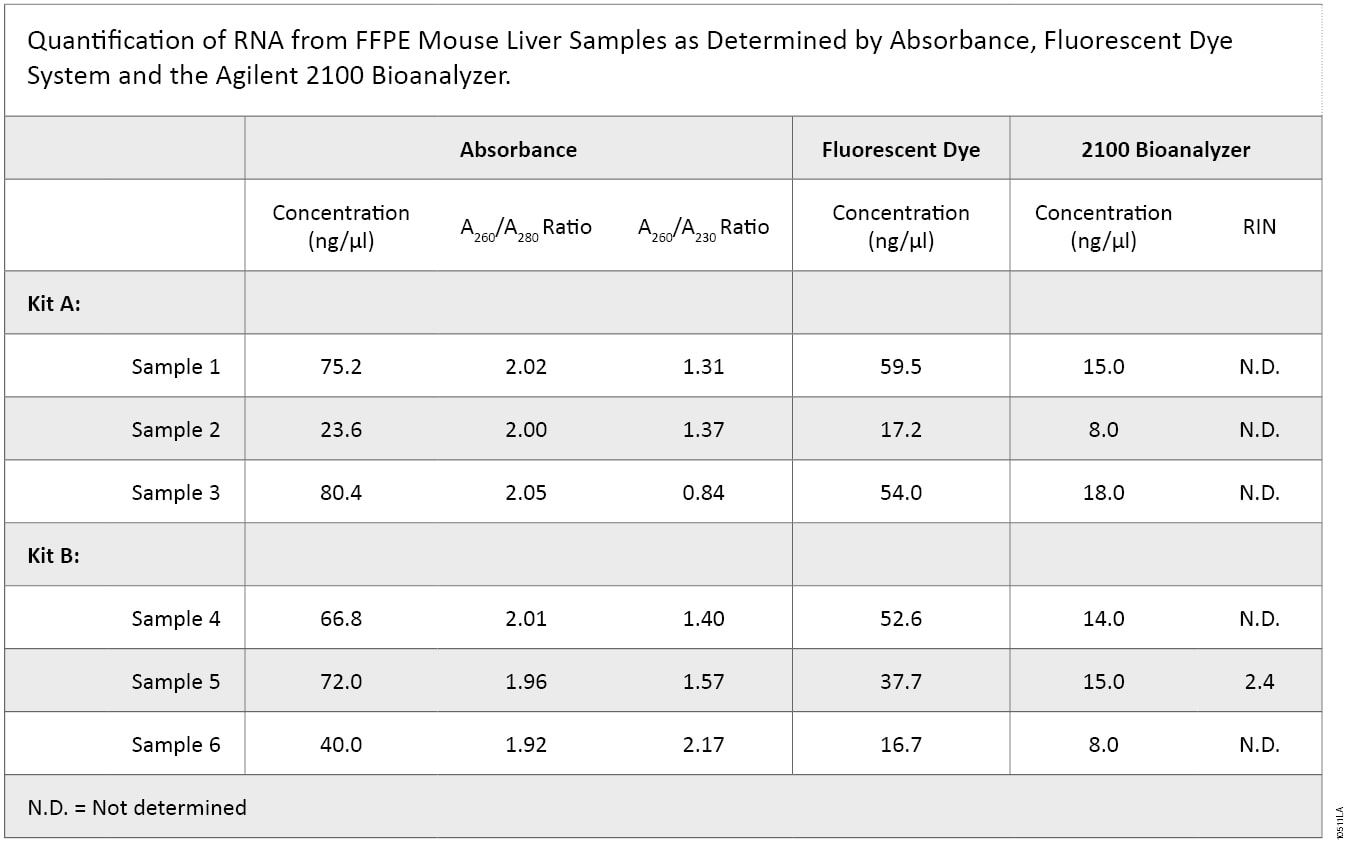
On average, the concentrations of RNA purified with Kit A and Kit B were similar. However, highly variable concentrations were calculated using the three different quantification methods, with the 2100 Bioanalyzer measuring significantly less RNA than absorbance- or dye-based methods. In addition, purity, as defined by the A260/A280 ratio, was similar between the two kits, while the A260/A230 ratio was higher overall for Kit B samples, suggesting that samples isolated using Kit B had higher purity.
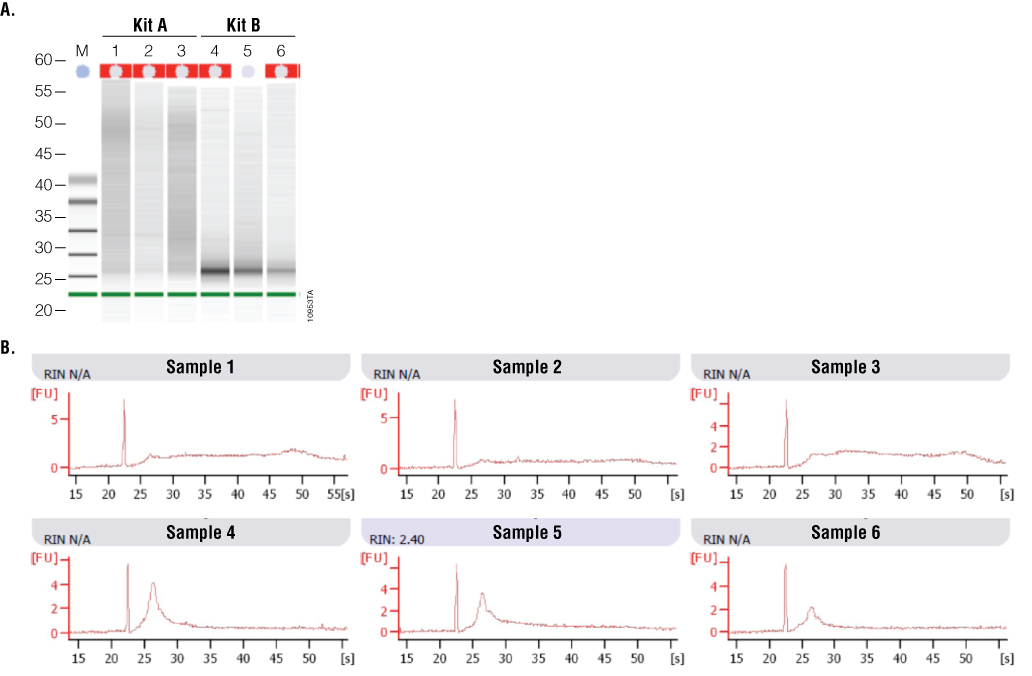
2100 Bioanalyzer analysis also showed a difference in RNA integrity between the two kits (Figure 5). FFPE samples typically result in highly degraded RNA, with most fragments less than 500 bases in length. This is readily apparent with the Kit B samples, which have a major low-molecular-weight band of highly degraded RNA present at around the 27-second period of analysis. In contrast, Kit A samples generally show a smear of higher-molecular-weight RNA with a less defined low-molecular-weight band. Poor RNA integrity is reflected in the RIN values in that five of the six samples were not assigned a RIN value. Thus, while RNA samples from Kit B were of relatively higher purity, RNA samples from Kit A were of higher integrity, as visualized by 2100 Bioanalyzer gel image analysis.
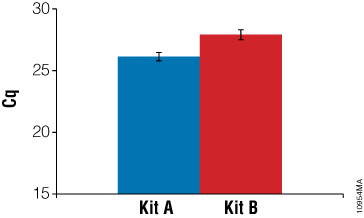
To examine how well the RNA samples amplified, RT-qPCR was performed using RNA-specific mouse β2-microglobulin primers. These primers generate an amplicon of 120bp. Twenty-five nanograms of input RNA, as determined by absorbance, was used in a one-step RT-qPCR system. Figure 6 shows a comparison of RNA performance from Kit A and Kit B. On average, RNA samples from Kit A had lower Cq values than RNA samples from Kit B. While absorbance data suggested Kit B samples were higher quality, the gel image from the 2100 Bioanalyzer suggested Kit A samples were of higher integrity. A third test of RNA quality using RT-qPCR confirmed that Kit A RNA samples were amplified with a higher efficiency than Kit B samples.
Conclusion
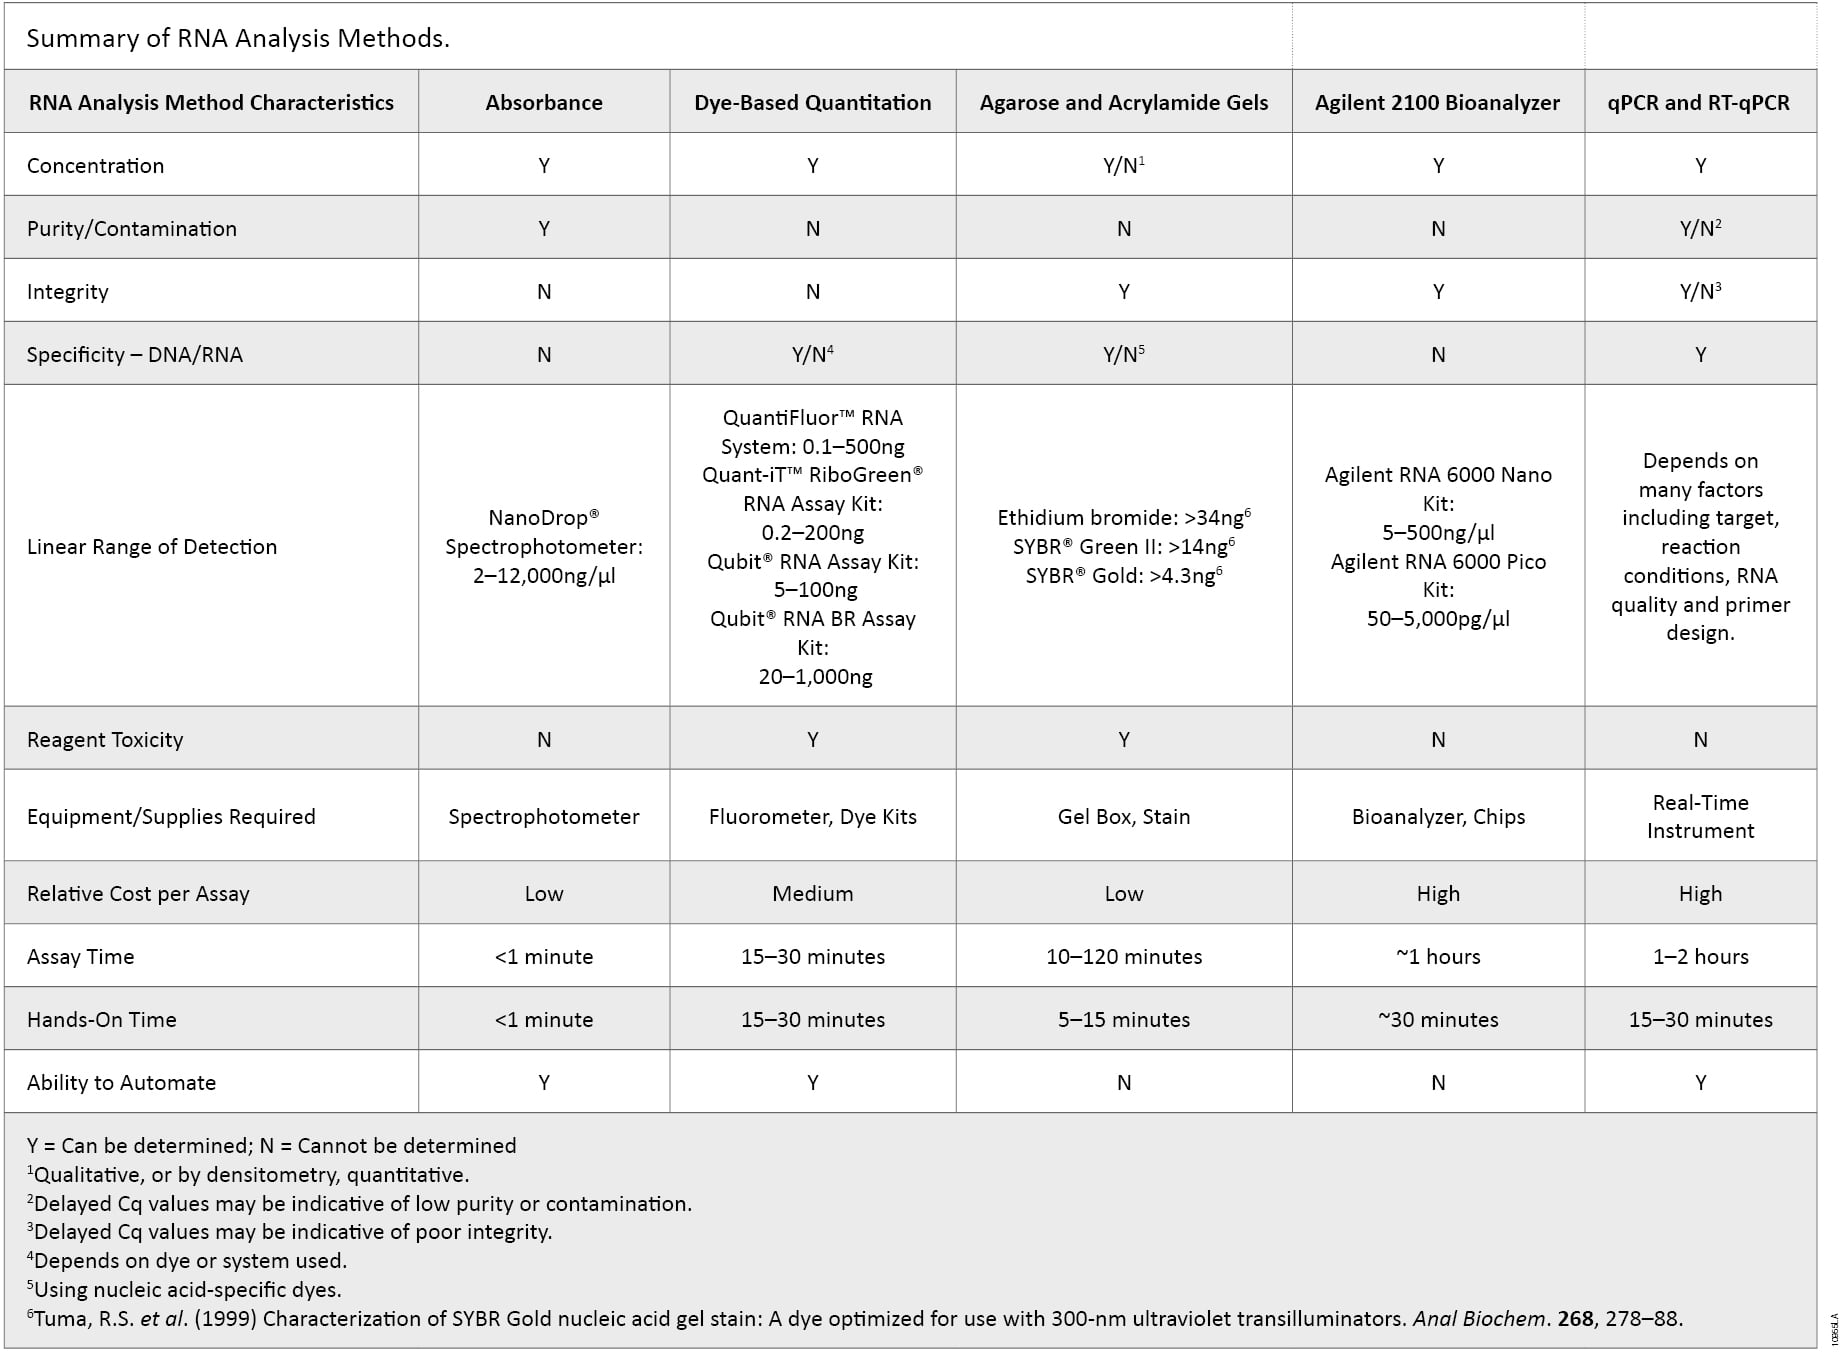
There are many characteristics of RNA samples that can affect the results in downstream applications. RNA concentration, purity, integrity, contamination by DNA or the presence of other contaminants often used in nucleic acid purifications may need to be determined to avoid repeating experiments and the associated high reagent, instrumentation and labor costs. Incorporating multiple methods of analysis, taking into account the major advantages of each method, provides a more complete understanding of the quality of the RNA sample (summarized in Table 2). Knowing the limits of each method could ultimately determine the success or failure of a given experiment as no single RNA quantification and quality control method is ideal.
References
- Tuma, R.S. et al. (1999) Characterization of SYBR Gold nucleic acid gel stain: A dye optimized for use with 300-nm ultraviolet transilluminators. Anal. Biochem. 268, 278–88
- Kirsanov, K.I. et al. (2010) SYBR Gold and SYBR Green II are not mutagenic in the Ames test. Mutat. Res. 699, 1–4
RT-PCR should be performed in both the absence and presence of the reverse transcriptase, to assess DNA contamination in the template RNA. In addition, "no-template" negative control reactions should always be performed.