Lumit® Cytokine Assays: Interpolating Data with the GloMax® Discover
Martha O’Brien
Promega Corporation
Publication Date: June 2021, tpub_222
Introduction
Lumit® Cytokine Immunoassays are rapid and convenient assays to quantify cytokine release from cultured cells. These add-and-read assays are based on NanoBiT® technology using antibodies labeled with SmBiT and LgBiT, the complementary parts of the NanoBiT® luciferase. SmBiT and LgBiT-labeled antibodies directed against a specific cytokine generate light when bound to the cytokine followed by addition of the detection reagent that includes luciferase substrate. Light is generated proportional to the amount of cytokine released. Standard curves of known concentrations of cytokine enable the conversion of the Relative Light Unit (RLU) readout to concentrations of cytokine. There are several ways to interpolate data from a standard curve, but the variety of method choices can lead to confusion. Furthermore, historical methods may not always be the best choice for a new assay.

The four-parameter logistics non-linear regression analysis, or 4PL, is commonly used for interpolating from an ELISA standard curve. 4PL is optimized for a sigmoidal dose response with the nonlinear regression estimating the high and low asymptotes, a slope and an inflection point. Immunoassays with a complete titration, from zero to significant excess of target protein, will produce a sigmoidal dose response due to the inherent properties of antibody binding. However, in practice, estimating the very high and very low concentrations is imprecise because the curve is flattening at the ends and introduces significant errors in these regions. Furthermore, at the low end, variable background signal can obscure assay signal. These precision constraints necessitate developing calibration curves from the most linear part of the sigmoidal curve, avoiding the high and low asymptotes. In fact, commercial ELISAs typically follow this prescription. In a logical extension, Herman et al. (2008) questioned whether 4PL is the ideal method for ELISA interpolation. They analyzed several ELISAs and concluded that 4PL is not ideal for curve fitting for typical ELISAs, and the shape of the typical ELISA calibration curve is better fit by a quadratic or cubic polynomial (2nd or 3rd polynomial) nonlinear regression.
To assess the best method for interpolating data from Lumit® Cytokine Immunoassays, we used the GloMax® Discover Microplate Reader to compare methods for the Lumit® IL-1β Immunoassay. The GloMax® Discover has built-in nonlinear regression programs and can rapidly interpolate unknown data without having to transfer data and analyze with commercial programs. The interpolated concentrations are conveniently displayed directly on the same image as the RLUs. Templates can be set up for a specific calibration curve and a particular method of interpolation, significantly improving efficiency.
Results
The Lumit® Cytokine Immunoassays have very broad dynamic ranges with calibration curves that cover > 3 logs of cytokine concentration. In contrast, most ELISA standard curves extend for < 2 logs (Figure 1). For both assay types, the calibration curves encompass the most linear portions of the sigmoidal curves as described above. A log-log scale shows the dynamic range comparison for the Lumit® IL-1β (Mouse) Immunoassay and a typical ELISA, and the equation of the line illustrates the near linear ranges of the calibration curves (Figure 1).
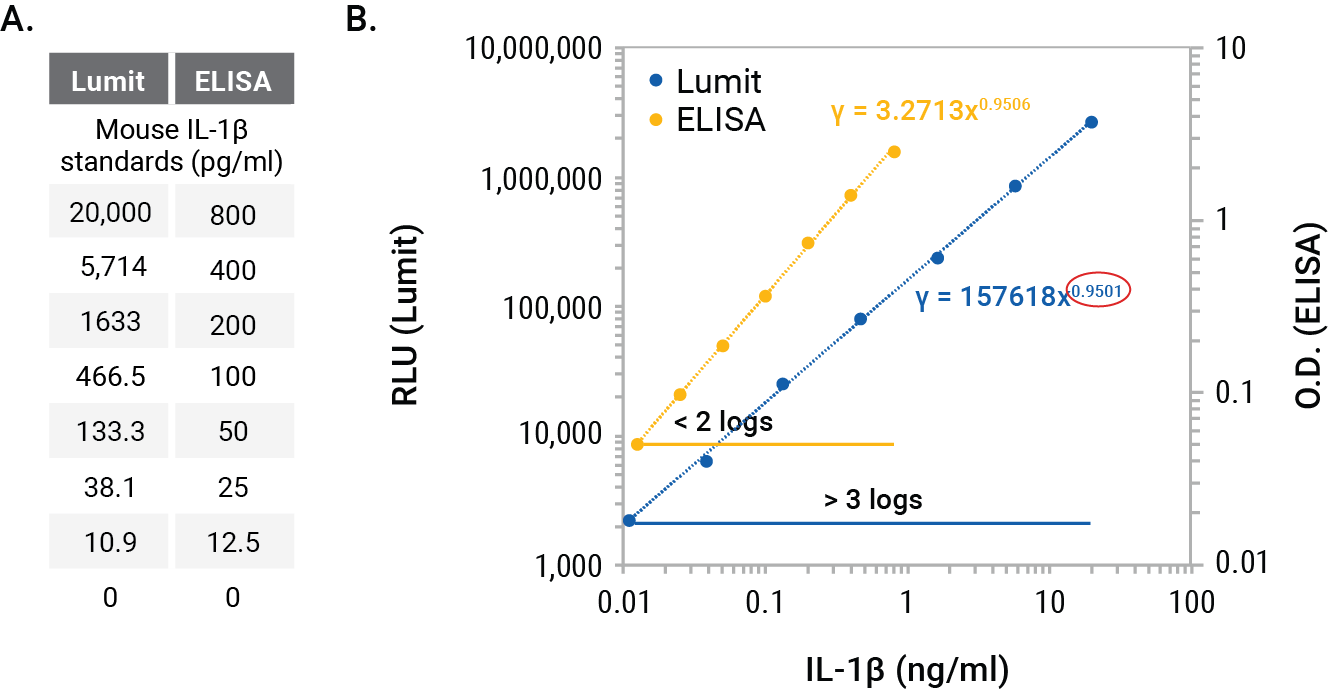
Figure 1. Calibration standards for Lumit® or ELISA mouse IL-1β (Panel A) and plots on a log-log graph (Panel B). The dynamic ranges for the assays are noted, and the power line equations are shown on the log-log scale. The power term circled in red denotes the slope, with a value of 1 indicating a linear graph. The values for both assays are slightly < 1, indicating near linear ranges of the sigmoidal curves but not completely linear over the entire range.
We used the Lumit® IL-1β (Mouse) Immunoassay to illustrate interpolation methods on the GloMax® Discover. Mouse J774A.1 macrophages were tested for inhibition of IL-1β release using the NLRP3 inhibitor, MCC950. Cells were primed with LPS (500ng/ml) overnight or left unprimed. The next day, a titration of MCC950 was added to the cells followed by treatment with nigericin (10µM) for 2 hours. Negative control cells were LPS-primed only (no nigericin) or cells treated with nigericin only (unprimed). The positive control cells were LPS-primed overnight followed by nigericin for 2 hours without the MCC950 inhibitor. The RLUs indicate significant release of IL-1β from cells primed with LPS and treated with nigericin, and this release is completely inhibited with MCC950 (Figure 2).
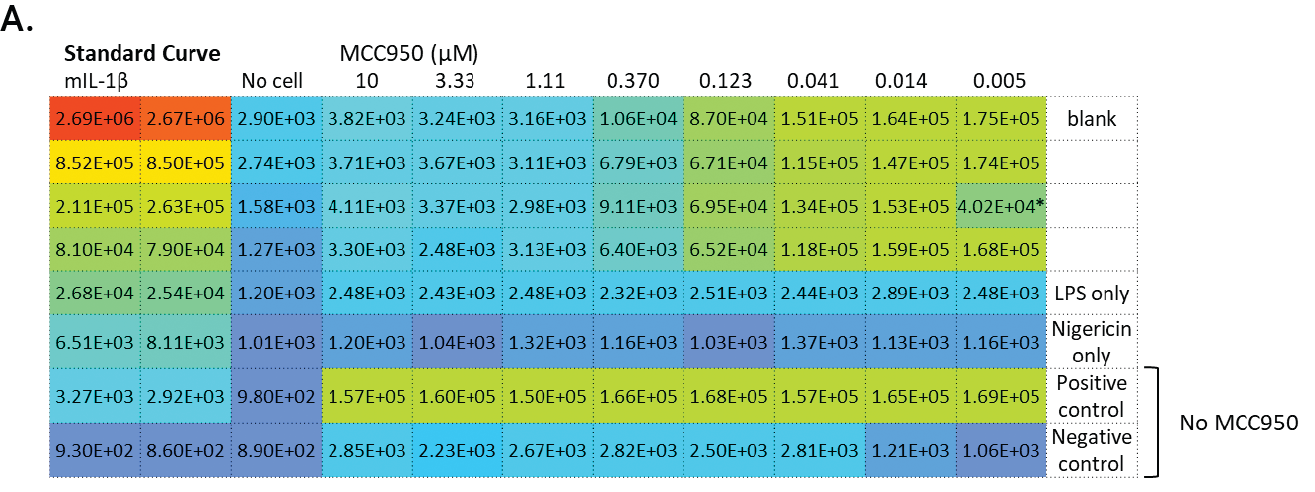
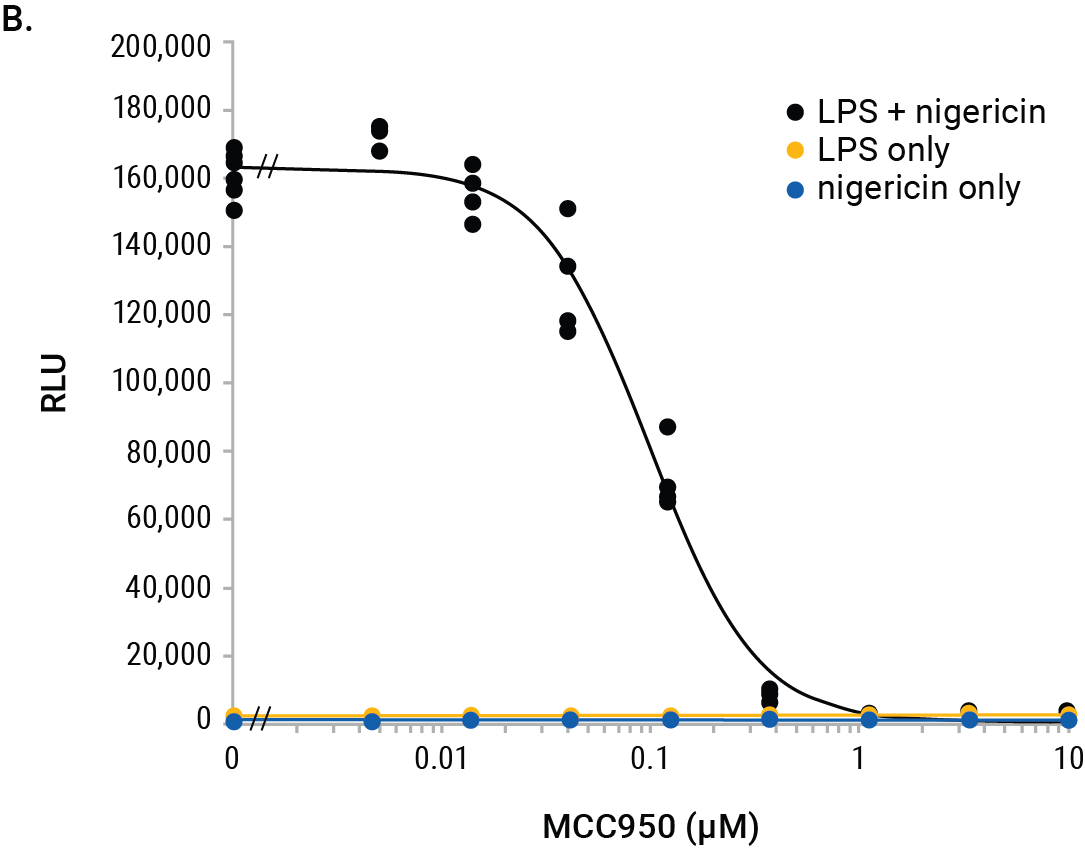
Figure 2. GloMax® Discover results from MCC950 inhibition of IL-1β release using the Lumit® IL-1β (Mouse) Immunoassay. J774A.1 cells (5 × 10⁴/well) were plated in 96-well plates (100µl/well) in columns 4–11 and either LPS-primed or left unprimed as noted. Standard curve wells, no-cell control wells and various control treatments are noted. After overnight priming, 50µl/well of culture media were removed and 25µl of 4X MCC950 titration or vehicle were added followed by 25µl of 4X nigericin (10µM final) and incubated for 2 hours. Final concentrations of MCC950 in rows A–F are shown, and wells with/without nigericin are noted. Row G has LPS + nigericin without MCC950, and row H shows LPS only (columns 4–9) and nigericin only (column 10–11) without MCC950. After nigericin treatment, 50µl of culture medium were removed (used for another assay), and 50µl of 2X Lumit® antibodies were added to all wells and incubated for 1 hour followed by 25µl of Lumit® Detection Reagent. Luminescence results are displayed in a colored heat map, where wells with red color indicate highest signals and wells with deep blue indicate the lowest signals (Panel A). The MCC950 inhibition curve is graphed within the GloMax® Discover software.
*denotes one replicate with inconsistent value
Interpolation programs are included on the GloMax® Discover and eliminate the need for data transfer. The interpolated values appear directly beneath the RLUs in the plate map. A template can be set up before recording luminescence, or the analysis can be done later.
The basic steps are:
- Click on “Analysis”.
- Enter the cytokine standard known amounts in the correct wells.
- Mark the unknown wells.
- Choose the interpolation program from the menu.
- Save template or run analysis program.
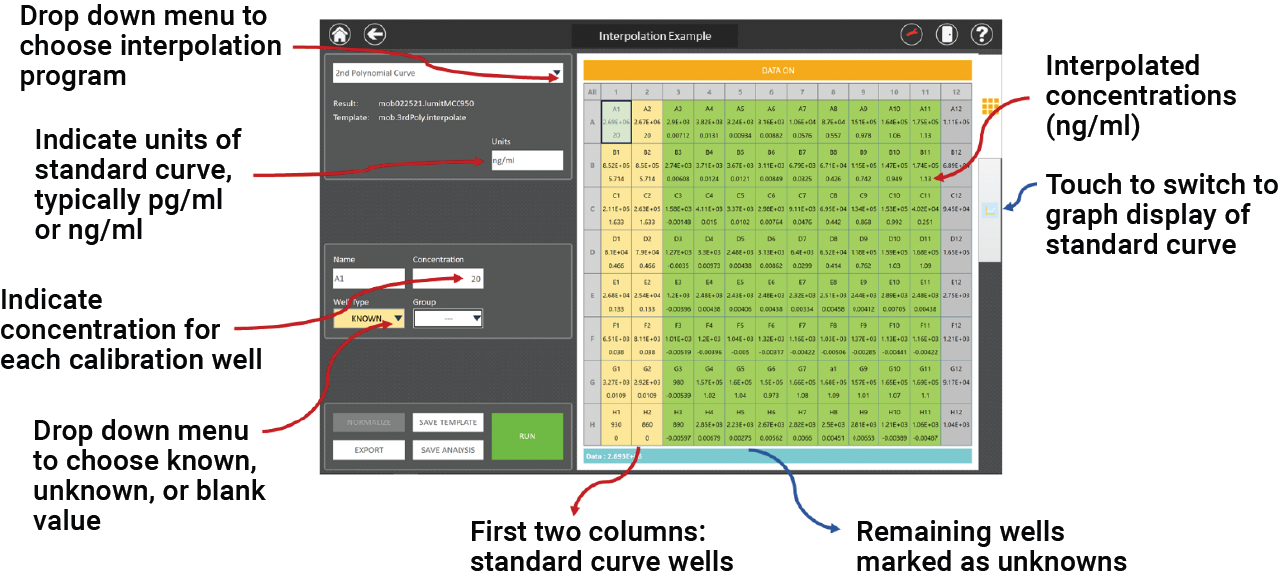
Figure 3. Screenshot of the GloMax® Discover analysis software. An example plate layout is shown with the Lumit® mouse IL-1β calibration concentrations in the first two columns and the remaining plate wells for unknowns. When the analysis is run, interpolated concentrations are displayed directly beneath the RLUs.
The GloMax® Discover nonlinear regression programs, 4PL, 2nd polynomial and 3rd polynomial, were compared to determine the best fit for the standard curve and interpolate the unknowns for the results shown in Figure 2. The nonlinear regression curves for the three methods reveal the best fit to be the 2nd polynomial (quadratic; Figure 4). The log-log scale clearly shows that the 3rd polynomial and 4PL do not demonstrate an ideal fit for the standard curve, missing the lowest two points of the standard curve. The interpolated values for the unknowns for each method confirm the appropriateness of the 2nd polynomial linear regression for interpolation (Figure 5, Panel A). The 4PL method did not generate interpolated values for RLUs at the low end of the calibration curve, and the 3rd polynomial method resulted in negative interpolated values from RLUs at the low end of the standard curve. The 2nd polynomial method resulted in accurate interpolated values throughout the entire range of the inhibition curve (Figure 5, Panel A). All three methods gave similar IL-1β quantities for the MCC950 inhibition curve and would be suitable for interpolation, but the comparison shows the improved calibration curve fit and subsequent improved accuracy of the 2nd polynomial interpolation method (Figure 5, Panel B).
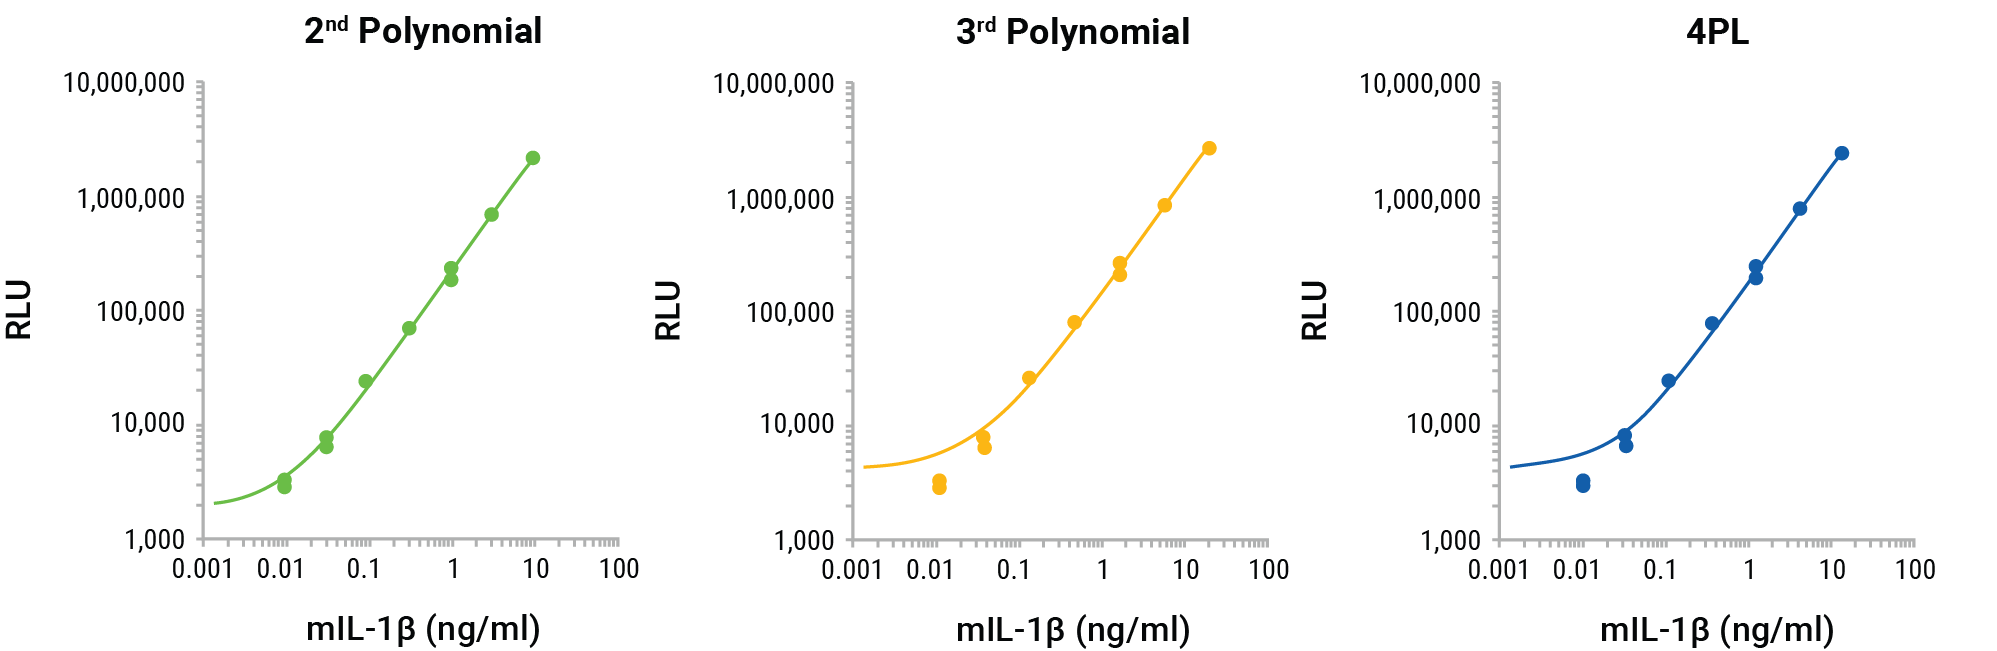
Figure 4. GloMax® Discover 2nd polynomial, 3rd polynomial and 4PL non-linear regression curve fitting for the Lumit® mouse IL-1β calibration standards. The 2nd polynomial non-linear regression curve better fits the entire calibration curve.
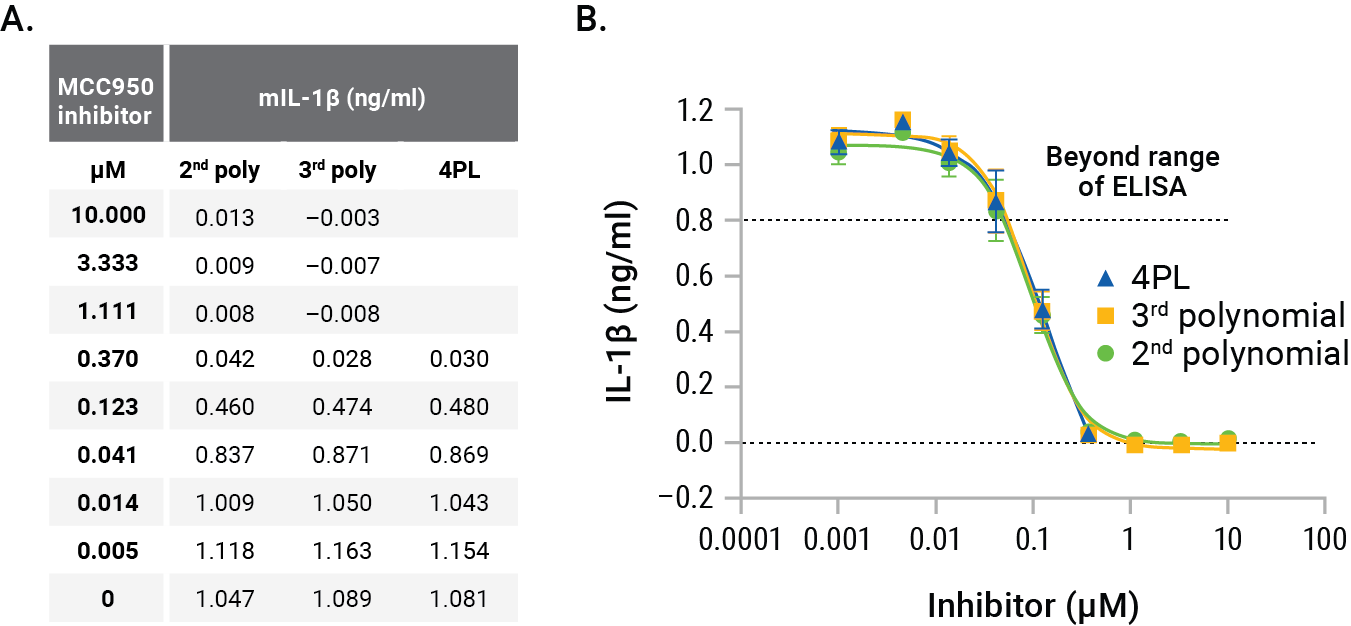
Figure 5. GloMax® Discover interpolation results. Comparing 2nd polynomial, 3rd polynomial and 4PL nonlinear regression methods for interpolating concentrations of IL-1β illustrates the slight differences in interpolated concentrations (Panel A). Graphing these different methods shows the suitability of the 2nd polynomial method (Panel B). Each point represents the average of four replicates. The MCC950 IC50s were calculated as 97nM (2nd polynomial), 98nM (3rd polynomial) and 142nM for 4PL.
The dynamic range of each assay is also important to compare. For the example in Figure 5, all concentrations of IL-1β secreted by cells were within the range of the Lumit® Immunoassay. The high concentration of IL-1β secreted by cells treated with low concentrations of MCC950 inhibitor would have been out of the range of the ELISA assay (Figure 1). This means that samples would need to be diluted to be within the range of the ELISA, requiring a second assay, or additional wells with diluted samples would need to be included in the original assay. Therefore, the broad dynamic range of the Lumit® Immunoassay saves researchers time in the lab.
Conclusion
The broad dynamic ranges of the Lumit® Cytokine Immunoassays enable direct measurements of released cytokine without having to dilute samples. When titrating an inducer or an inhibitor, this results in greater capture of data without having to dilute different concentrations of the test agent to ensure the values fall within the standard curve range.
For the LPS-primed J774A.1 cells treated with nigericin, the amount of IL-1β released from 5 × 10⁴ cells/well led to concentrations that would have been beyond the ELISA standard curve range (Figure 1), complicating the assay setup since wells with lower MCC950 concentrations would have required dilution to be within the ELISA dynamic range. The Lumit® Immunoassay enabled quantifying released IL-1β from a very broad MCC950 inhibitor range of 10µM down to 5pM without having to dilute any of the samples (Figure 5). The broad dynamic range captured the highest levels of IL-1β from uninhibited cells, and the sensitivity detected the lowest levels of IL-1β from nearly completely inhibited cells.
A comparison of different nonlinear regression curve fitting and interpolation methods indicated that the 2nd polynomial method was a better fit for the broad calibration curve of the Lumit® IL-1β (Mouse) Immunoassay compared to 4PL or 3rd polynomial, and likewise the 2nd polynomial method was better able to interpolate values over the entire dynamic range compared to the other two methods. The IC50s were similar for 2nd and 3rd polynomial, at 97 and 98nM respectively, but different from the 4PL calculated IC50 of 142nM. The limitations of the 4PL interpolation would indicate the higher IC50 is not accurate.
The GloMax® Discover System enables very rapid interpolation of unknown cytokine concentrations with built-in programs and convenient displays of interpolated values right in the same well as the RLU value. The simple analysis setup also enables a rapid comparison of different non-linear regression curve fits and interpolation methods to quickly determine the best method. Consistent with Herman et al. (2008), these results demonstrate that polynomial methods for calibration curve fitting and interpolation are well suited for the Lumit® IL-1β (Mouse) Immunoassay.
References
Herman, R.A. et al. (2008) Evaluation of logistic and polynomial models for fitting sandwich-ELISA calibration curves. J. Immunol. Methods 339, 245–58.