Developing Effective Degrader Compounds: Why Cellular Degradation Kinetics Are Key
Michele Arduengo, Promega Corporation
Publication date: July 2025
Introduction
In 2001 scientists designed the first proteolysis-targeting chimera (PROTAC)—a molecule that brings a specific protein into contact with a ubiquitin ligase, triggering the protein’s degradation by the cell’s own machinery1. Degrader compounds work by co-opting endogenous degradation pathways (such as the Ubiquitin-Proteaseome System (UPS) or the lysosomal/autophagy pathways) to remove disease-causing proteins from cells. Unlike traditional drugs that must stay bound to a protein to block its function, this "event-driven" drug action allows a degrader to briefly attach to its target and still trigger its destruction2. Once the target is marked for degradation, the degrader can detach or be cleared from the body, yet the effect may last because the target protein has already been removed. The event-driven nature of protein degradation has significant implications regarding the importance of understanding the cellular degradation kinetics of each event when designing degraders.
Degrader compounds opened the door to targeting proteins that couldn’t be reached with traditional drugs like small-molecule inhibitors or antibodies. In 2019, the first PROTAC-based drug candidate, ARV-110, entered clinical trials for prostate cancer, and ARV-471 is an estrogen receptor-targeting PROTAC for breast cancer. In March 2025, Phase III clinical trial data was positive3,4.

Types of Protein Degraders
Beyond small-molecule PROTACs and molecular glues that use the UPS, the field of targeted protein degradation has rapidly expanded to new degrader types and cellular degradation pathways1. Different degrader types are suited to different kinds of therapeutic targets and offer certain advantages and disadvantages. The table below offers a brief explanation of degrader types and their cellular pathways as well as the typical targets of each type.
- Molecular Glue (sometimes called small-molecule PROTACs) Directs degradation through the UPS pathway, using small molecules to promote and stabilize the interaction between the target protein and an endogenous receptor of E3 ligase. These degraders typically target small intracellular proteins like transcription factors or difficult targets where a small molecule can induce E3 binding. Examples include iMiDs (immunomodulatory drugs) including thalidomide or other imides that are being used to treat specific cancers, such as multiple myeloma.
- PROTAC (heterobiofunctional) Directs degradation through the UPS pathway by recruiting the target protein to an E3 ligase via simultaneous binding to both, using small molecules with two distinct ligands connected by a flexible linker.
- LYTAC (or Ab Conjugate) Uses the lysosomal degradation pathway. Typical targets of LYTAC degraders are extracellular or membrane proteins and circulating proteins. These degraders are useful in oncology or immunology against receptors or for secreted pathological proteins. An example includes ASGPR-Ligand-LI-6 conjugate targeting IL-6 in circulation.
- Autophagy or Chaperone-Mediated Autophagy (CMA) degraders. These can work via the UPS or lysosomal pathways. Chaperones or CHIP are recruited to target misfolded proteins or toxic aggregates.
- RIBOTAC (Nucleic acid degraders) These recruit RNase L or RNA-binding nucleases to a target RNA, leading to RNA cleavage. Targets include disease-related RNAs such as viral RNAs, oncogenic long non-coding RNAs and difficult-to-inhibit mRNAs. Example in research: RIBOTAC that degrades miRNA-21 by recruiting RNase-L.
Kinetics of Targeted Cellular Protein Degradation
Because protein degradation is an event-driven, rather than occupancy-driven, mechanism, the effect of a protein degrader on a target is determined by several factors beyond just how much target it can eliminate at saturation (extent of degradation). How fast it induces degradation and how long the degradation effect persists also determine degrader effects1. There are several ways to describe and quantify these kinetic factors including:
- maximal fraction of protein degraded for a given concentration within a kinetic timespan (Dmax or % degradation at plateau)
- concentration to achieve half-maximal degradation (DC50). Typically measured with an endpoint assay
- rate of degradation (which may be expressed as an initial slope or a rate constant k)
- time to onset of degradation (lag time before target loss begins)
- time to reach Dmax
- duration for which the target remains at Dmax before recovering
- maximum recovery observed (Rmax)
Looking at the kinetics of degradation becomes important for understanding efficacy because two degraders may both reach 90% Dmax, but one might act rapidly and the other extremely slowly, or the target could rapidly rebound from degradation with one degrader versus another. A degradation time-course is recommended to determine the degradation half-life (t1/2) or rate constant of the target protein being targeted by the degrader. Looking at the area under the degradation curve by integrating the extent and duration of target suppression enables comparison of compounds that achieve similar Dmax and rate of degradation but differ in how long is required for the target to recover.
Common Degrader Kinetic Profiles
Because successful targeted protein degradation requires many steps, the kinetic profiles of degraders can be quite different. However, several recurring profile shapes have been observed over time.
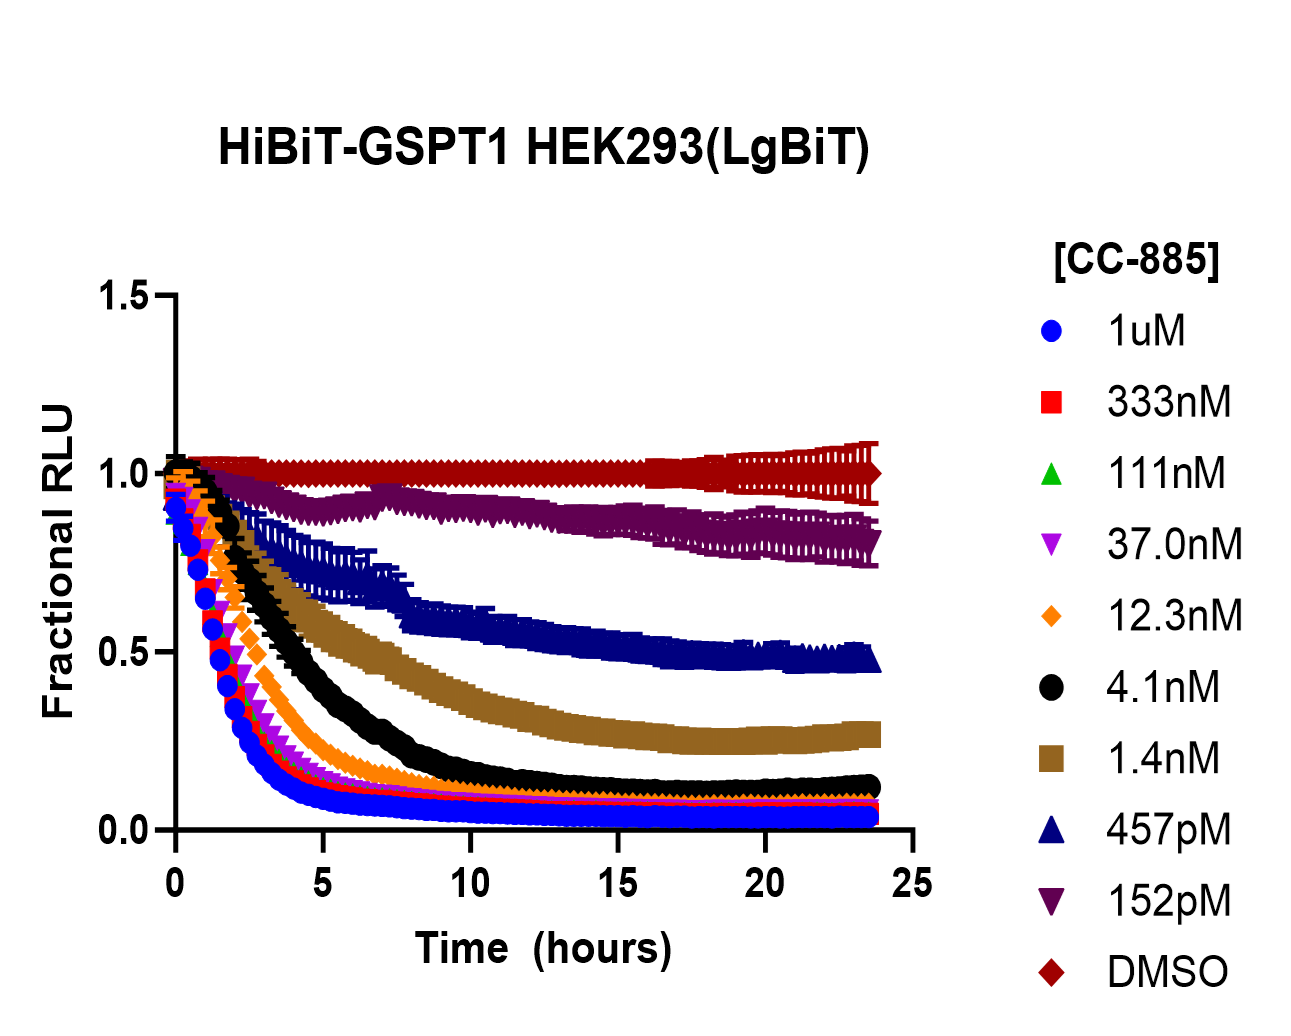
Classic profile: Rapid, dose-dependent and complete degradation with sustained low target levels. This is the ideal degrader profile characterized by immediate initiation and a steep drop in target protein levels, usually within a few hours. Activity is dose dependent. Highly potent classic degraders work at nanomolar levels. Some PROTACs also show a "hook effect", biphasic dose response where exceedingly high concentrations reduce efficacy, caused by saturating the target or the E3 ligases in the binary complexes.
Partial Degradation Profile: Target levels decrease by plateau at an intermediate level (30–60% of the target protein remains), resulting in a higher Dmax value.
Linear (Slow) Profile: Gradual, roughly linear decrease in target protein levels over time. There is no fast phase or plateau. Instead, the protein declines at a low constant rate, often never reaching 90%-100% knockdown.
Delayed-Onset Profile: No significant reduction in the targeted protein observed for some time. After degradation begins, the target loss will follow a pattern of classic, partial or linear degradation.
Rapid Recovery Profile: This profile is distinct from others because of the rapid return of the target protein to a new equilibrium or baseline once the degrader is removed or depleted.
In practice, degraders can behave as mixtures of these categories. Analyzing the full kinetic curve at multiple concentrations can help understand degrader mechanisms and inform optimization steps to improve the degrader profile.
Measuring the Kinetics of Targeted Protein Degradation
Measuring protein degradation kinetics requires capturing the target’s abundance over time under degrader treatment. Traditional potency measurements for degraders often used a single timepoint (e.g. % degradation after 24 hours, or a DC50 derived from a dose–response at an endpoint). However, single timepoint assays can be misleading if two compounds reach the same end level but have two different profiles. Therefore, a variety of kinetic assays have been developed to more fully characterize degrader performance.
Time Course Experiments: Performing a time-course experiment in cells can provide information about the timing of events during protein degradation. For a time course, cells are treated with a degrader at a specific concentration and sampled over time (e.g., 0.5, 1, 2, 4, 8, 25 hours) to measure remaining target protein using Western blot or ELISA/immunoassays. Plotting the degradation curve can reveal parameters including t1/2 and Dmax and the degradation rate constant, which can be compared for different compounds.
Real-Time, Live-Cell Assays: New technologies enable measuring protein levels in live cells continuously, greatly facilitating kinetic readouts. One approach is to tag the target protein with a luminescent or fluorescent reporter that can be monitored non-invasively. For instance, the Promega HiBiT system or NanoLuc Fusion Tags allow the target’s abundance to be measured in real time by adding a substrate to the culture media and reading luminescence. For HiBiT assays, its complementation partner LgBiT, can be easily introduced using the ViaScript® LgBiT mRNA Delivery system to enable live-cell analysis. As the protein is degraded, the signal diminishes, and these changes can be recorded in a plate reader at frequent intervals (e.g., every few minutes).
Pulse-Chase and Turnover Analysis: Another method is metabolic labeling or pulse-chase, where the target synthesis is halted (for example, with cycloheximide) and then the degrader is added. By monitoring how the remaining protein decays, one can determine if the degrader accelerates the protein clearance relative to its natural half-life. This approach was more common before real-time assays were available, and it provides a measure of the induced degradation rate. It is still useful to isolate degradation from ongoing synthesis.
Ubiquitination and Intermediate Measurements: To mechanistically link kinetics, assays measuring earlier steps can be used. For example, one can perform a time-course to detect target ubiquitination (using ubiquitin-remnant profiling or immunoprecipitation of ubiquitinated targets). Rapid appearance of ubiquitinated targets often precedes and predicts fast degradation. If a compound shows target binding but no ubiquitination in cells, that explains a lack of degradation. There are also fluorescent reporter systems for ubiquitination (e.g. fluorescence resonance energy transfer probes that change when a target is ubiquitinated). Additionally, biophysical kinetics of ternary complex formation can be measured (for instance, stopped-flow kinetics for assembly and dissociation), although these are typically in vitro. Such data, when available, help interpret the cell-based kinetic profile (e.g. if a compound has slow ternary complex on-rate, a delayed degradation might result).
Because full kinetic profiling for every compound is resource intensive, a compromise is to pick an early and a late timepoint assay for initial screens (e.g., measure percent degradation at 6 hours and 24 hours), followed by detailed kinetic analysis of the most promising compounds. This allows degrader compounds to be characterized by kinetics early (rapid degradation) versus later (rapid recovery). Once you have kinetic data, you can compare compounds by plotting one parameter against another. For instance, a scatter plot of degradation rate v. Dmax could reveal clusters of compounds (e.g, some with high Dmax but variable rates; others that are fast but only lead to partial degradation).
Measuring and understanding the kinetics of the events involved in targeted protein degradation enables quicker optimization of targeted protein degraders because it delivers a nuanced picture of the steps and possibilities in the degradation pathway. As more degraders are profiled, their kinetics can be linked to therapeutic outcomes. Will certain kinetic data be more predictive of efficacy than others? Kinetic assays will directly inform the design and selection of drug candidates.

Citations
- Sakamoto, K. M. 2001. "Protacs: Chimeric Molecules that Target Proteins to the Skp1-Cullin-F Box Complex for Ubiquination and Degradation." Proceedings of the National Academy of Sciences USA (National Academies of Science) 98 (15): 8554-8559. Accessed June 12, 2025. doi: 10.1073/pnas.141230798.
- Riching, K., Caine, E.A., Urh, M., and Daniels, D.L. 2022. "The Importance of Cellular Degradation Kinetics for Understanding Mechanisms in Targeted Protein Degradation."Chem Soc Rev (Royal Society of Chemistry) 51: 6210-6221. doi:10.1039/d2cs00339b.
- Pfizer. 2025. Arvinas and Pfizer Announce Positive Topline Results from Phase 3 VERITAC-2 Clinical Trial. March 11. Accessed June 13, 2025. https://www.pfizer.com/news/press-release/press-release-detail/arvinas-and-pfizer-announce-positive-topline-results-phase#:~:text=The%20Phase%203%20VERITAC-2%20clinical%20trial%20%28NCT05654623%29%20is,patients%20with%20ER%2B%2FHER2-%20advanced%20or%20met.
- Neklesa, T. Synder, L.B., Willard, R.R., Vitale,N., Pizzano,J., Gordon, D.A., Bookbinder, M., Macaluso, J., Dong, H., Ferraro, C., Wang, G., Wang, J. Crews, C.M., Houston, J., Crew, A.P., and Taylor, I. 2019. "ARV-110: An Oral Androgen Receptor PROTAC Degrader for Prostate Cancer." Journal of Clinical Oncology. American Society of Clinical Oncology. 259. doi:https://doi.org/10.1200/JCO.2019.37.7_suppl.259.
- Varshavsky, Alexander. 2008. "Discovery of Cellular Regulation by Protein Degradation." Journal of Biological Chemistry 283 (50): 4469-34489. doi: 10.1074/jbc.X800009200.
Related Resources

Bioluminescence Imaging Solutions for Targeted Protein Degradation
Learn how the GloMax® Galaxy enables imaging the degradation of HiBiT-tagged proteins.
Targeted Protein Degradation Services
Accelerate the discovery and development of degrader molecules with our comprehensive screening and profiling services.