Improving the Genetic Analysis Workflow: From FFPE Tissue DNA Extraction to MSI Analysis
Promega Corporation
Publication Date: September 2012
Abstract
We describe the modification of several key steps in the DNA isolation process to develop a high-quality genetic analysis workflow using FFPE tissue as the test sample. We demonstrate the utility of the Maxwell® 16 Instrument for automated DNA purification from Proteinase K-digested FFPE tissue samples, using prefilled cartridges from the Maxwell® 16 FFPE Tissue LEV DNA Purification Kit. The extracted FFPE DNA is quantitated and evaluated with qPCR, multiplex real-time PCR methods. We also compare the use of GoTaq® MDx Hot Start with AmpliTaq Gold® Star in MSI analysis and outline an effective workflow for genetic analysis.
Scientists have long used formalin-fixed paraffin-embedded (FFPE) tissue samples to examine tissue morphology at the cellular level. The FFPE process not only preserves tissue morphology and protein antigens, but also encapsulates nucleic acids within the protein:protein network. By employing PCR amplification technologies, these trapped nucleic acids become targets for more sensitive and specific genetic analysis than can be performed by conventional histological analysis.
Unfortunately, FFPE processing of tissue results in crosslinks between the protein and DNA and introduces compounds that can inhibit amplification. Not only can isolation of DNA from FFPE tissue be tedious and time-consuming, the quality of purified DNA generated by suboptimal purification methods can be poor and can significantly reduce both the detection efficiency and sensitivity in subsequent PCR-based genetic analyses.
In this article, we describe the modification of several key steps in the DNA isolation process to develop a high-quality genetic analysis workflow using FFPE tissue as the test sample. We demonstrate the utility of the Maxwell® 16 Instrument for automated DNA purification from Proteinase K-digested FFPE tissue samples, using prefilled cartridges from the Maxwell® 16 FFPE Tissue LEV DNA Purification Kit. The extracted FFPE DNA is quantitated and evaluated with qPCR, multiplex real-time PCR methods. We also compare the use of GoTaq® MDx Hot Start with AmpliTaq Gold® Star in MSI analysis and outline an effective workflow for genetic analysis (Figure 1).
 Figure 1. Workflow from sample to MSI analysis for FFPE tissues. Suggested isolation, quantitation, amplification and analysis tools for use in a workflow starting with FFPE tissue.
DNA Purification
The first critical step in genetic analysis is isolation of high-quality DNA. There are several different DNA extraction methods that can be used with FFPE samples as shown in Figure 1. In this article we used the Maxwell® 16 System, which is a low- to moderate-throughput automated purification system that uses prefilled cartridges for simple, rapid nucleic acid purification from a wide variety of sample types. DNA can be extracted from up to 16 FFPE tissue samples at one time, in approximately 30 minutes, after Proteinase K treatment. This short purification time reduces the possibility of damage to the DNA.
Here two 5µm FFPE tissue sections of normal human intestinal tissue (BioChain Institute, Inc) were extracted in quadruplicate with the Maxwell® 16 FFPE Tissue LEV DNA Purification Kit according to the protocol in the Technical Bulletin (Figure 2).
 Figure 2. Overview of the Maxwell® 16 FFPE Tissue LEV DNA Purification protocol.
 DNA Quantitation: Choosing a Method
Many sensitive genetic analyses require high-quality DNA for reliable results (1) . Formalin fixation of tissue is known to adversely affect DNA, resulting in variable quality of DNA obtained from individual FFPE tissue samples. Therefore, assessment of DNA quality after isolation is crucial to acquiring meaningful data from FFPE tissues. To determine the quality of DNA purified using the Maxwell® 16 FFPE Tissue LEV DNA Purification method, we evaluated the functional yield (quantity of DNA, usability in amplification and degree of fragmentation) using several quantitation methods. The benefits and limitations of each method tested are discussed below.
The NanoDrop® is a micro-volume spectrophotometer that integrates a patented sample retention technology for samples as small as 1µl, to measure the UV absorbance of the samples. The technology allows measurement at wavelengths other than 260nm, such that nucleic acid purity can be evaluated. The NanoDrop® spectrophotometer is commonly used to evaluate the quality of purified nucleic acid. However, the limit of detection for the NanoDrop® is 2ng/µl, which limits its use in FFPE samples with low amounts of DNA; it is not capable of discriminating between the variety of compounds that absorb at 260nm, so the method is not specific to DNA or RNA. Thus, the NanoDrop® results typically overestimate the actual nucleic acid content of the sample.
Fluorometric-based methods of quantitation rely on intercalating dyes that are highly specific for double-stranded (ds) DNA. These methods can be extremely sensitive to low amounts of DNA but generally require a standard for accurate measurement. The QuantiFluor™ dsDNA System (Cat.# E2670) allows quantitation of samples in concentrations as low as 50pg/ml. Samples used with this method may have to be diluted beforehand and these methods do not give purity estimates.
Real-time qPCR assays, such as the GoTaq® qPCR Master Mix (Cat.# A6001), have emerged as the method of choice to measure DNA quantities in purified samples and to assess the quality of nucleic acid samples. Because degraded, badly modified and crosslinked DNA will not be amplified, the qPCR result will only reflect amplifiable DNA. The system contains BRYT Green® dye, a proprietary fluorescent DNA binding dye that exhibits greater fluorescence enhancement upon binding to dsDNA than does SYBR® Green I. Combined with the GoTaq® Hot Start Polymerase, optimized buffer and proprietary dye, GoTaq® qPCR Master Mix provides robust real-time PCR.
Plexor® HY System (Cat.# DC1001) is a real-time PCR assay used to determine the concentration of total human DNA and male human DNA simultaneously in one reaction. The kit contains an internal PCR control (IPC) to test for false-negative results that may occur in the presence of PCR inhibitors and a melt curve function to confirm that the correct product was amplified. The system works by measuring a reduction in fluorescence signal during amplification. Amplification of each target uses only two primers, one of which contains both a fluorescent tag and a modified base. As amplification proceeds, fluorescence is reduced by site-specific incorporation of a fluorescent quencher opposite the complementary modified base. The quencher is in close proximity to a fluorescent dye located on the end of the primer, resulting in a reduction of fluorescent signal. After PCR, a melt analysis can be performed to provide an internal control for the final assay design or to expedite troubleshooting.
To quantitate the concentration of DNA we used the following DNA quantitation methods, per the manufacturer’s instructions: QuantiFluor™ dsDNA System (Cat.# E2670), GoTaq® qPCR Master Mix (Cat.# A6001), Plexor® HY System (Cat.# DC1001) and NanoDrop® UV absorbance measurements. The amplicon size for the GoTaq® qPCR System is 200bp.
Different quantitation methods yielded different results for the same FFPE DNA preparations (Figure 3). To briefly summarize yields:
NanoDrop® UV absorbance > Plexor® HY System > GoTaq® qPCR method > QuantiFluor™ dsDNA
 Figure 3. DNA amounts by various quantitation methods.
 DNA amounts quantified as specified in the manufacturers' instructions.
The results suggest that NanoDrop® overestimated the DNA quantity, presumably due to lack of specificity for DNA. On the other hand, the GoTaq® qPCR method detects the real amplifiable DNA (functional yield) in the extraction, which is the most biologically relevant template for downstream amplification. The main advantage of GoTaq® qPCR method is that it is a functional assay that measures the amount of amplifiable DNA instead of just the amount of total nucleic acid. QuantiFluor™ dsDNA produced results close to those obtained by the GoTaq® qPCR method.
The higher value determined by the Plexor® HY System may be due to the copy number and size differences of the target: Plexor® HY System detects a multi-copy (>10 copies) 99-base-pair target. Smaller DNA fragments are preserved more effectively by the formalin fixation and paraffin-embedding process and are easier to extract.
To correlate functional yield to fragmentation character for the extracted DNA, we evaluated the yield of different sizes of DNA fragments using primer sets that generate 100, 200, 300 and 400bp products with GoTaq® qPCR Master Mix. Table 1 shows different DNA concentration depending on amplicon size. Lesser amounts of DNA are detected as the amplicon size increases (2) . This result suggests that: 1) larger DNA is more degraded, hence more small sized DNA survived the three fixation and extraction processes, and; 2) larger DNA has more modifications and crosslinking, hence was not amplified.
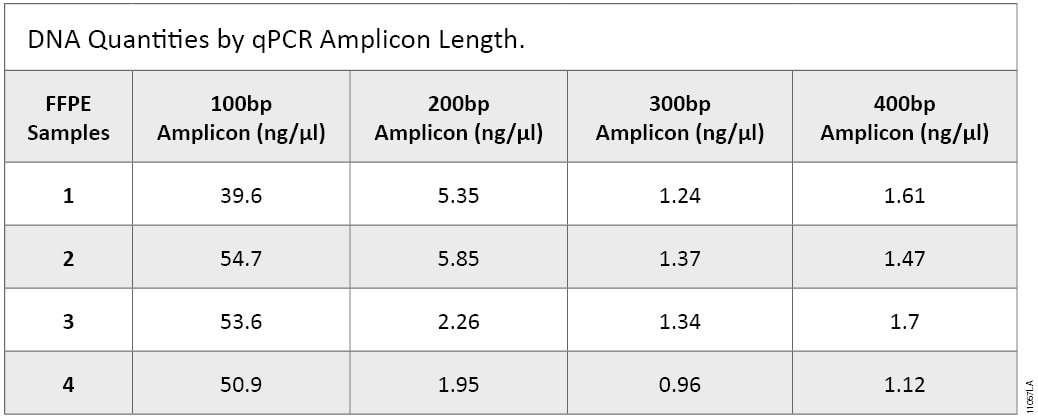 Table 1. DNA quantities by amplicon length in a qPCR amplification.
PCR Amplification
Most genetic analyses are based on PCR techniques, such as real-time PCR, DNA sequencing, single-nucleotide polymorphism (SNP) and short tandem repeat (STR) analysis. Thermostable DNA polymerase is one of the key components affecting the performance of these techniques. We compared the performance of GoTaq® MDx Hot Start Polymerase and AmpliTaq Gold® DNA Polymerase in Microsatellite Instability (MSI) Analysis. The amplification reactions were set up according to Technical Manual #TM255, for the MSI Analysis System, Version 1.2, and performed with the GeneAmp® PCR System 9700. A shorter activation time was used with the Promega GoTaq® MDx Hot Start Polymerase.
| Amplification Mix: | |
| Nuclease-Free Water | 5.85μl |
| Gold ST★R 10X Buffer | 1.00μl |
| MSI 10X Primer Pair Mix | 1.00μl |
| GoTaq® MDx Hot Start Polymerase (5u/μl)* | 0.15μl |
| Template DNA | 2μl (1ng total) |
| Total reaction volume | 10.00μl |
The cycling conditions were set as follows (Note: GeneAmp® PCR system 9700 thermal cycling conditions are in 9600 emulation mode and use the silver block):
• 95°C for 2 minutes (or 11 minutes for AmpliTaq Gold® DNA polymerase) , then:
• 96°C for 1 minute, then:
• ramp 100% to 94°C for 30 seconds,
• ramp 29% to 58°C for 30 seconds,
• ramp 23% to 70°C for 1 minute,
• for 10 cycles, then:
• ramp 100% to 90°C for 30 seconds,
• ramp 29% to 58°C for 30 seconds,
• ramp 23% to 70°C for 1 minute,
• for 20 cycles, then:
• 60°C for 30 minutes
• 4°C soak
Detection of Amplified Fragments and Data Analysis
The amplified fragment was detected with an ABI PRISM® 3100 Genetic Analyzer with Data Collection Software, Version 2.0. The instrument was configured with a 36cm capillary array and performance optimized polymer 4 (POP-4™; Applied Biosystems). The sample preparation was carried out according to Technical Manual #TM255 for MSI Analysis System. Briefly, following amplification, 1µl of amplified sample is mixed with 10µl of loading cocktail (mixture of the internal lane standard and Hi-Di™ formamide). The instrument injection time was set to 5 seconds and the injection voltage was 3kV. The run time was lengthened to 2,000 seconds and took approximately 45 minutes.
The data analysis was performed using GeneMapper®, Version 4.0 software, and MSI Panels and Bins files were used to allow automatic assignment of genotypes. The result indicated that reactions with GoTaq® MDx Hot Start Polymerase or AmpliTaq Gold® DNA Polymerase generated five similar and nearly monomorphic mononucleotide repeat profiles (BAT-25, BAT-26, MON0-27, NR-21 and NR-24) and two highly polymorphic pentanucleotide repeat profiles (Penta C and Penta D) with balanced peak intensities (Figure 4). The reactions with GoTaq® MDx Hot Start Polymerase yielded allele profiles that had higher peaks than those yielded by reactions with AmpliTaq Gold® DNA polymerase. The data obtained with GoTaq® MDx Hot Start Polymerase provided better performance in the assay, and independent tests showed that PCR amplifications with GoTaq® MDx Hot Start produced informative allele profiles with less DNA than amplifications with AmpliTaq Gold® DNA polymerase (data not shown).
 Figure 4. Graphical comparison of AmpliTaq Gold® polymerase to GoTaq® MDx Hot Start Polymerase. The top panel shows a sample electropherogram of MSI analysis. The bottom panel shows the comparison of Relative Fluorescence Units when using GoTaq® MDx Hot Start (Cat.# D6001) versus AmpliTaq Gold® DNA Polymerase in the MSI assay. GoTaq® MDx Hot Start Polymerase gave greater RFU signals.
Summary
Many genetic analyses use complex multiplexed PCR amplifications that require optimal DNA input for detection accuracy and sensitivity. Performing genetic analysis with DNA extracted from FFPE samples can be very challenging. The DNA quality extracted from FFPE samples can be dramatically different depending on tissue types, FFPE processing methods and age of the sample. Many FFPE DNA extraction methods produce DNA samples with variable yield that can be contaminated with PCR inhibitors.
The Maxwell® 16 Instrument and Maxwell® 16 FFPE Tissue LEV DNA Purification Kit offer an automated DNA extraction solution that provides reliable and consistently purified DNA samples. They minimize the potential for human error and reagent variations. The purified DNA is consistently compatible with downstream PCR-based assays, such as MSI analysis.
DNA extracted from FFPE samples is often fragmented or chemically modified, which can make it unavailable for amplification. The NanoDrop® DNA quantitation method is not specific to DNA, and will also measure RNA or any other substance present in the sample that absorbs light at a wavelength of 260nm. This results in overestimated yields, leading to insufficient template being added to the amplification reaction, causing assay failures.
This study showed that real-time PCR detection methods can reliably quantify the functional DNA yield in the FFPE extract. Moreover, the functional yield for specific different size fragments sizes can be estimated using an amplicon of the desired size. Using input DNA quantities based on target size can minimize error in the downstream applications, resulting in more successful assays. In this study, we chose a 200bp amplicon as the qPCR target, which covers the largest PCR fragment in the MSI analysis.
In addition to using the correct amount of template DNA, using high-quality reagents can also improve the genetic test result. We demonstrated that GoTaq® MDx Hot Start can be used in place of AmpliTaq Gold® for MSI analysis and gives better performance. In conclusion, the use of a consistent nucleic acid purification method, reliable DNA quantitation and robust PCR performance reagents will make your genetic analysis workflow more efficient.
References
- van Beers, E.H. et al. (2006) A multiplex PCR predictor for aCGH success of FFPE samples. Br. J. Cancer 94, 333–7.
- Nassif, N. and Hendricksen, A. (2012) Purification of quality RNA from FFPE tissue using the ReliaPrep™ FFPE Total RNA Miniprep System. BioTechniques, 204–5.
Related Products
| Product | Size | Catalog No. |
| QuantiFluor™ dsDNA System | 1ml | E2670 |
| GoTaq® qPCR Master Mix | 200 reactions | A6001 |
| Plexor® HY System | 200 reactions | DC1001 |
| GoTaq® MDX Hot Start Polymerase | 100 units | D6001 |
| AmpliTaq Gold® DNA polymerase (5u/μl; Invitrogen) | 1,500 units | N8080242 |
Related Products
Related Articles
Article References
- van Beers, E.H. et al. (2006) A multiplex PCR predictor for aCGH success of FFPE samples. Br. J. Cancer 94, 333–7.
- Nassif, N. and Hendrickson, A. (2012) Purification of quality RNA from FFPE tissue using the ReliaPrep™ FFPE Total RNA Miniprep System. BioTechniques 52, 204–5.
How to Cite This Article
Scientific Style and Format, 7th edition, 2006
Gorshe, R., Brekke, A. and Zhao, R. Improving the Genetic Analysis Workflow: From FFPE Tissue DNA Extraction to MSI Analysis. [Internet] September 2012. [cited: year, month, date]. Available from: https://www.promega.com/resources/pubhub/improving-the-genetic-analysis-workflow-from-ffpe-tissue-dna-to-msi-analysis-pubhub-article/
American Medical Association, Manual of Style, 10th edition, 2007
Gorshe, R., Brekke, A. and Zhao, R. Improving the Genetic Analysis Workflow: From FFPE Tissue DNA Extraction to MSI Analysis. Promega Corporation Web site. https://www.promega.com/resources/pubhub/improving-the-genetic-analysis-workflow-from-ffpe-tissue-dna-to-msi-analysis-pubhub-article/ Updated September 2012. Accessed Month Day, Year.