Designing a Bioluminescent Reporter Assay: Normalization Options
Chris Eggers, Brad Hook, Samantha Lewis, Carl Strayer and Amy Landreman
Promega Corporation. 2016
Abstract
When designing a bioluminescent reporter assay, normalization should be an essential part of the assay plan in order to control for variables other than those being tested. Here we show how to normalize your bioluminescent reporter assay experiments.
Why Include Normalization in Your Experiment?
Normalization is commonly used in many types of experimental methods as a process to correct for variations caused by factors other than what is directly being tested. For luminescent genetic reporter experiments, normalization can be particularly valuable because commonly used transient transfection methods can introduce variability from a number of sources, such as those listed in Table 1. Including a normalization step reduces variability, makes data comparisons easier and improves statistical significance and confidence in your data. Although there are a number of methods to consider for normalization, this article primarily focuses on experimental optimization and data analysis when using co-transfected control reporters.
Available Options for Normalization
Typical methods for normalization of genetic reporter data include normalization to total protein content, normalization to cell health (viability) or normalization to a co-transfected internal control reporter. Normalization to total protein using a Bradford assay, for example, controls for variation in total cell number and may be used when working with stably transfected cells where sources of variability are more limited. However, protein assays are the least facile option (e.g., they cannot be multiplexed with reporter assays) and therefore are not considered in this discussion.
Multiplexing with Markers of Cell Health
Although not necessarily used for normalization, multiplexing a reporter assay with a compatible cell viability marker provides a means to understand reporter gene expression in the context of cell health. For example, a fluorescent, nonlytic viability assay can be performed upstream of a luminescent reporter assay, enabling sequential analysis of both viable cells and reporter expression from the same well. When using either a single- or dual-reporter assay with two experimental reporters, a cell health assay can enable better interpretation of the data and account for reduction in reporter activity caused by toxicity of compound treatment (Figure 1).
Figure 1. Measuring antioxidant response element (ARE) and heat shock response element (HSE) responses followed by cell viability from the same sample. HepG2 cells were transfected with pNL[NlucP/ARE/Hygro] and pGL4.41[luc2P/HSE] and treated with tBHQ. Following overnight incubation, the CellTiter-Fluor™ Cell Viability Assay was used to measure cell viability, followed by the NanoDLR™ assay to measure HSE and ARE responses.
Working with Internal Control Reporters
Normalization to an internal control reporter is typically the best method to control for the variables introduced in a transfection-based experiment. This method uses a constitutively expressed control reporter vector that is co-transfected with the experimental vector. The luminescence of both are measured sequentially using a dual-reporter assay (Table 2), and a normalized ratio is obtained for each well by calculating “Experimental Reporter Activity/Control Reporter Activity”. This method accounts for well-to-well variability caused by differences in transfection efficiency, cell number, number of viable cells or edge effects caused by position on the plate. Figure 2 demonstrates the difference in coefficients of variation (CV) for data from a single-reporter assay with no normalization versus normalized data obtained using a dual-reporter assay (NanoDLR™ or Dual-Glo®). Normalizing the data for each well corrects for variability and significantly reduces the overall CVs obtained, improving data quality.
Figure 2. Comparison of coefficients of variation (CVs) obtained from a single reporter read vs. normalized data using either the NanoDLR™ or Dual‐Glo® assays. For each reagent, the inner 60 wells of a 96-well plate of HEK293 cells were transiently transfected with constitutively expressed firefly luciferase and either constitutively expressed NanoLuc® (NanoDLR™) or Renilla luciferase (Dual-Glo® Assay). Following overnight incubation media was removed, the plate washed with PBS and new media added. Firefly luciferase levels were measured followed by measurement of NanoLuc® or Renilla using NanoDLR and Dual-Glo, respectively. CVs were calculated across each plate for the individual reads and also following data normalization.
Optimizing Control-Reporter Experiments
Selecting a control reporter and promoter
The reporter used as the internal control must be different from the one used as the experimental reporter because the activity of both will be measured in the same cells or cell lysates (Table 2). In general, the signal from the control reporter should be high enough to be easily and accurately measured but low to avoid interference with the experimental reporter expression (discussed below) and avoid detection assay issues (substrate depletion or saturation of the detection instrument). Fortunately, that leaves a very wide range. Both the luminescent reporter and the promoter that drives its expression will contribute to the overall signal obtained. The relative luminescence from each reporter/promoter combination can vary depending on the particular cell type being used (Figure 3); therefore, co-transfection conditions should be considered and optimized for your particular experimental conditions.
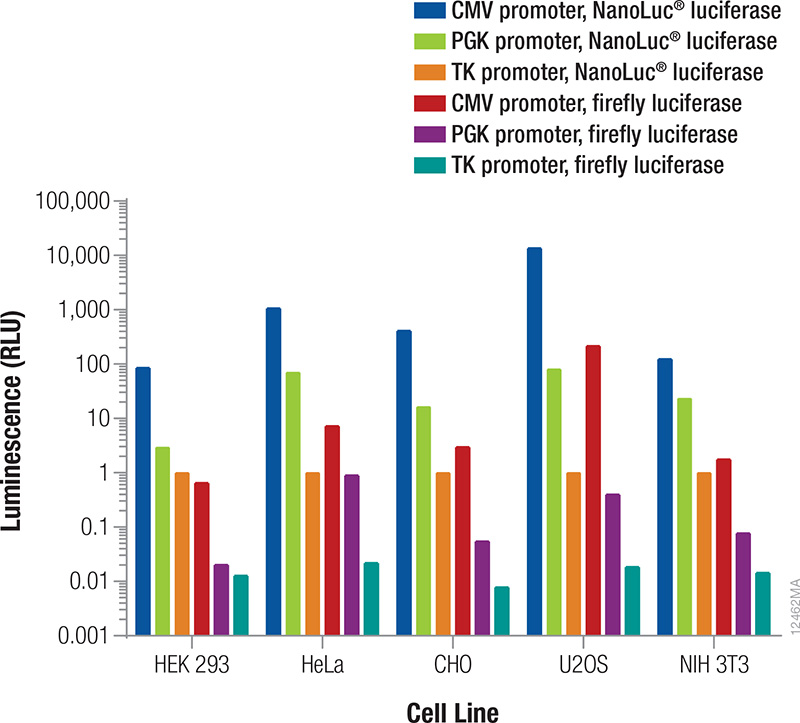
Figure 3. Relative luminescence for firefly and NanoLuc® luciferases expressed from constitutive promoters in multiple cell types. Cells were transiently transfected with varying amounts of DNA containing firefly or NanoLuc® luciferase expressed from CMV, PGK or TK constitutive promoters. After 24 hours expression, luminescence was measured using the NanoDLR™ Assay, and the approximate relative luminescence compared to TK-NanoLuc® was calculated for those DNA amounts giving usable signals. These values can inform the choice of control reporter construct and the appropriate amount or dilution of DNA to transfect to achieve a desired signal.
Optimizing co-transfection conditions
The expression level of the control reporter is also determined by the amount of the control vector included in your co-transfection, and the optimal experimental vector:control vector ratio needs to be determined. Typically, you will co-transfect the minimum amount needed to give significant reporter activity over background. Transfection of high amounts of control plasmid may lead to transcriptional squelching or other interference with the experimental promoter, i.e., trans effects, between promoters. Figure 4 demonstrates the importance of minimizing co-reporter levels. Co-transfecting the Renilla co-reporter at a 10:1 (firefly:Renilla) ratio caused the firefly luciferase signal to be decreased by approximately 50%, and at a 1:1 ratio almost 70% inhibition of the firefly signal was observed. Interestingly, co-transfection of the NanoLuc® luciferase had a minimized impact on the firefly luciferase signal causing only about 20% inhibition at 10:1 and 1:1 transfection ratios.
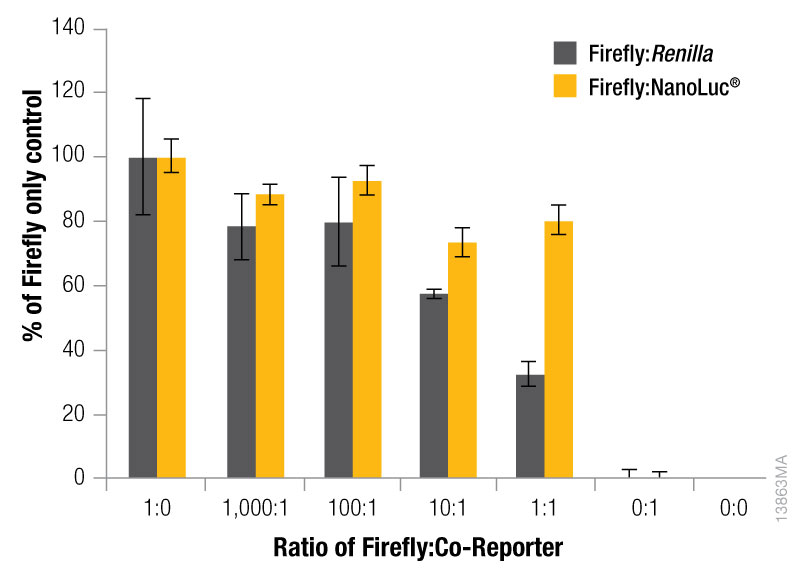
Figure 4. The effect of co-reporter expression levels on firefly signal with NanoDLR™ or DLR™ Assay. Firefly luciferase vector mass was maintained at 500ng, while co-reporter (NanoLuc® or Renilla) vector mass varied from 5–500µg. N = 8 for each condition. Total transfection amount was held constant at 1μg by adding transfection carrier DNA.
To optimize the amount of co-reporter needed for your assay conditions we recommend first optimizing the conditions for your experimental reporter. Next, empirically determine the amount of co-reporter needed by co-transfecting a varying amount of control vector to find the minimal amount that provides sufficient response to be confidently measured. Figure 5 shows an example of this type of optimization experiment in which firefly levels are held constant as the experimental reporter, while increasing amounts of a TK-driven co-reporter, Renilla or NanoLuc® luciferase are transfected. This data demonstrates that the optimal amount of co-reporter will depend on both on the co-reporter and detection reagent used. When using Renilla luciferase as a co-reporter, you will likely need to use higher co-transfection amounts to obtain acceptable signal, particularly if using the Dual-Glo® detection reagent, and caution should be taken to ensure that impact on the experimental reporter is not observed. When using Renilla luciferase as control reporter, a stronger promoter may be required to obtain sufficient expression levels. In contrast, even at the lowest co-transfection level NanoLuc® luciferase gives a robust response enabling the NanoLuc® control reporter to be used at levels 10,000X lower than the firefly reporter (10,000:1). In addition, we recommend expressing NanoLuc® luciferase from a constitutive promoter that is less active than a CMV promoter, such as PGK or TK, to obtain appropriate expression levels. Finally, note that the signal from the control reporter need not be higher or lower than the signal from the experimental reporter.
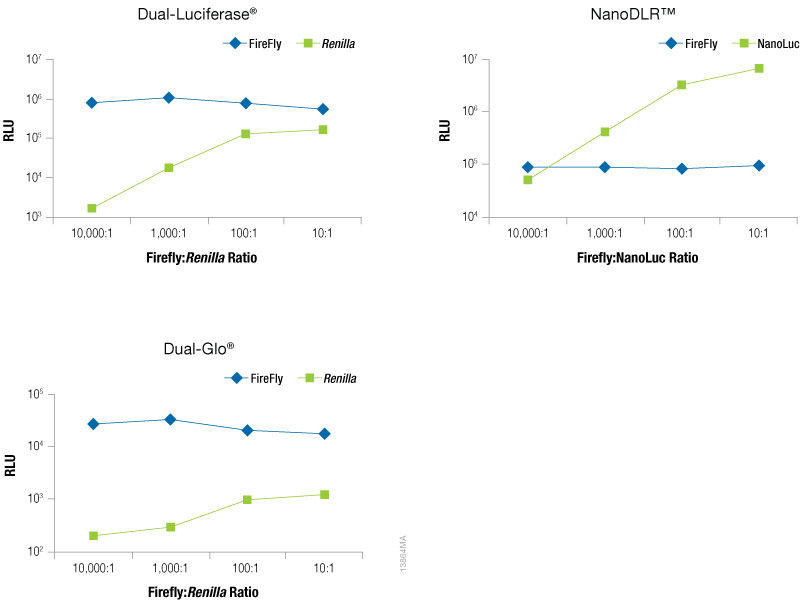
Figure 5. Raw RLUs for firefly and co-reporter (NanoLuc® or Renilla) luciferase when co-reporter DNA amount was titrated against a constant level of firefly luciferase (Fluc). Firefly luciferase vector was maintained at 500ng, while co-reporter (NanoLuc® or Renilla) vector varied from 500pg–50ng. N = 8 for each condition. Total transfection amount was held constant at 1μg by adding transfection carrier DNA.
Analyzing your co-reporter data
After calculating the normalized ratio for each well, the data can be used directly or further analyzed in a number of ways depending on the experimental design. A simple method of analysis is to average the normalized data for each treatment and then determine the fold change in activity between two test groups using the following equation:

This method provides the relative difference in activity between treatments within a single experiment. The normalized fold change in activity from each experiment can then be averaged and statistical analysis performed.
Calculating a relative response ratio
An alternate approach is to calculate a Relative Response Ratio (RRR). The RRR permits the comparison of multiple treatments from different experiments because it provides a framework to compare treatment effects. Calculation of RRR requires the inclusion of two sets of controls on each plate: a positive control that provides maximal expression from the experimental reporter and a negative control that provides minimal (basal) expression. If these two samples are included on every plate, the effect of each new compound can be quantitatively evaluated by its influence on the experimental reporter within the context of the positive and negative control.
For example, if the ratio of experimental reporter luminescence to control reporter luminescence is 53 for the positive control, 1.3 for the negative control, and 22 for the experimental treatment, all of these values can be scaled so that the positive control is assigned the value of 1, and the negative control is assigned the value of 0. The RRR for each experimental treatment can then be calculated using this formula:
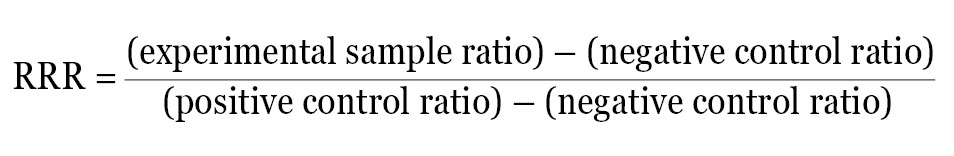
The RRR for the experimental treatment example listed above would be:
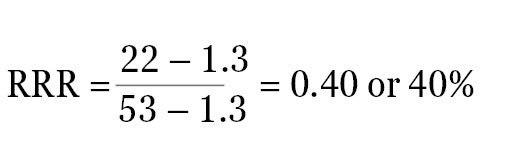
The experimental compound is 40% as effective as the positive control at increasing expression of the experimental reporter at this concentration. Note: If the raw luminescence signal values of signals are close to background luminescence signal values (from nontransfected cells or media-only control wells), the luminescence values will need to be background subtracted before the ratios are calculated.
Summary
Inclusion of an internal control reporter remains the most effective method for reducing variability in transient transfection-based genetic reporter experiments. When designing your experiment to include a control reporter, a number of parameters need to be considered in order to obtain optimal results.
Determining the appropriate co-reporter, promoter and dilution of DNA for co-transfection will depend largely on your specific experimental conditions, i.e., the size of the wells, the number of cells, the ability of the cells to be transfected and the detection reagent used. Although often used a sensitive experimental reporter, NanoLuc® luciferase provides an excellent alternative to Renilla as a co-reporter for firefly luciferase. Its bright signal, about 100-fold brighter than Renilla allows NanoLuc® luciferase to be used at very low dilutions, minimizing impact on the firefly luciferase reporter and reducing the overall amount of DNA that is required for the transfection.
Related Products and Resources
Further Learning
For a side-by-side comparison of Promega Firefly, NanoLuc® and Renilla reporter assays, see the Reporter Assay Comparison Guide. For detailed data and information on individual assays, visit the product page for each system.