Adeno-Associated Virus Research
Adeno-associated virus (AAV) has become one of the most promising viral vectors for gene therapy, enabling efficient delivery of genetic materials to both dividing and non-dividing cells. AAVs are replication defective, non-pathogenic, non-cytotoxic and can maintain physiologically relevant expression levels in cells and tissues.
Challenges for developing AAV-based gene therapy include lack of standardized analytical methods, limitations in manufacturing scalability, and the widespread presence of AAV neutralizing antibodies in humans. Learn how our unique AAV solutions can help overcome these obstacles.
We're here to help solve challenges in your research—just ask us!
Genome Titer
Viral genome titer measures the number of viral particles that contain the therapeutic gene. This metric is critical for determining the correct dose needed to achieve a therapeutic effect while minimizing the risk of toxicity or immune reactions.
Accurate Quantification of AAV Genome Titer
DNase is commonly used before qPCR or dPCR to measure AAV genome titer, but inconsistent digestion can lead to variable results. The TruTiter® Reagent System eliminates this issue by selectively amplifying only DNA encapsulated within intact AAV capsids. This allows for accurate quantification of viral genomes without the need for DNase treatment.
See more data in this poster: A Novel Technology for Accurate Quantification of Viral Genome Titers
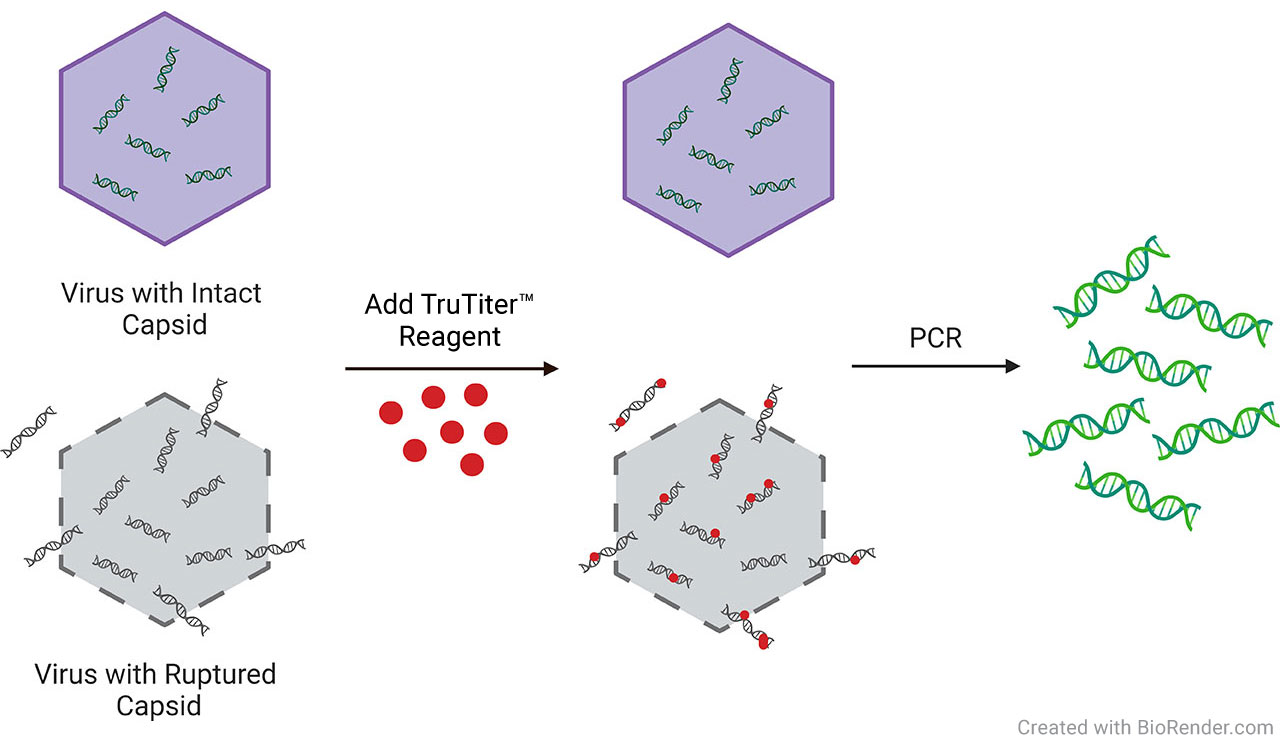
With TruTiter® Reagent, only the DNA inside the intact capsid can be amplified for accurate genome titer.
TruTiter® Reagent Results in Less Variability
Compared to DNase-Based dPCR Workflows

AAV2-NanoLuc® viral capsids (1010GU/ml) were treated at 65°C for 10 minutes. Following heat treatment, the AAV particles were treated with either DNase (red) or TruTiter® Reagent (green) and amplified using dPCR with 8 technical replicates each.

AAV2-NanoLuc® viral capsids (1010GU/ml) were treated with 0.1% Tween®-20 for 10 minutes. Following detergent treatment, the AAV particles were treated with DNase (red) or TruTiter® Reagent (green) and amplified using dPCR, with 8 technical replicates each.

AAV2-NanoLuc® viral particles (107GU/ml) were treated at the indicated temperature for 10 minutes. Following temperature treatment, the AAV particles were treated with DNase (red) or TruTiter™ Reagent (green) followed by dPCR. In parallel, a 24-hour infectivity assay (blue) was performed using HEK293 cells. To aid interpretation, data is represented as percent of signal achieved with the room temperature (R.T.) treatment.
Neutralizing antibody (NAb) assessment is crucial in AAV-based gene therapy, as NAbs can hinder vector transduction and reduce efficacy. In addition, pre-existing NAbs from prior AAV exposure can affect biodistribution and therapeutic outcomes. Screening for NAbs helps identify suitable candidates and optimize dosing to overcome immune barriers.
In Vivo Biodistribution
Understanding in vivo biodistribution helps ensure that the gene therapy reaches the intended target tissue at effective levels while minimizing exposure to non-target organs.
Detecting In Vivo Tropism and Biodistribution with NanoLuc® Luciferase
Nano-Glo® Fluorofurimazine In Vivo Substrate (FFz) is an aqueous-soluble substrate optimized for in vivo detection of NanoLuc® Luciferase with enhanced bioavailability, resulting in bright and stable signals. Its handling is compatible with in vivo workflows, offers flexible delivery options, and enables dual-luciferase imaging with both NanoLuc® and firefly luciferases.
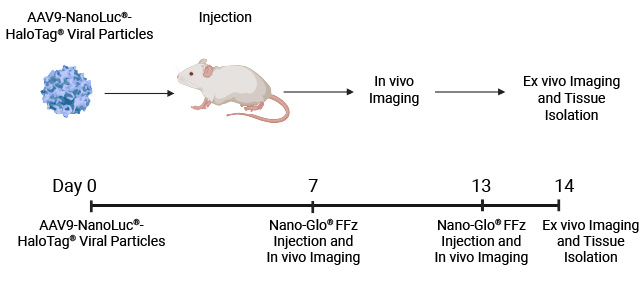
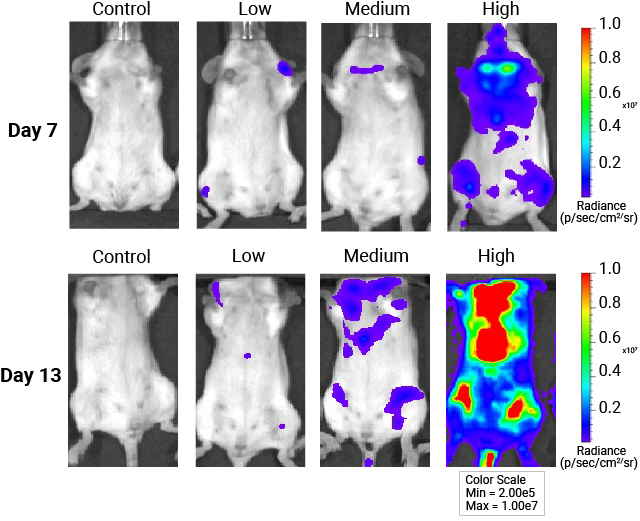
In vivo whole-body imaging of mice injected with AAV9-NanoLuc®-HaloTag® viral particles. Mice were injected with increasing levels of AAV9-NanoLuc®-HaloTag® viral particles. Nano-Glo® FFz (0.44μmoles) was injected 7- and 13-days post-transduction followed by in vivo imaging. Tissue tropism starts to appear at 7 days, and a stronger signal and more extensive tissue tropism is visible after 13 days. Bioluminescence imaging was done at the University of Wisconsin Small Animal Imaging and Radiotherapy Facility.
Genomic Analysis Workflow for AAV in vivo Biodistribution Studies
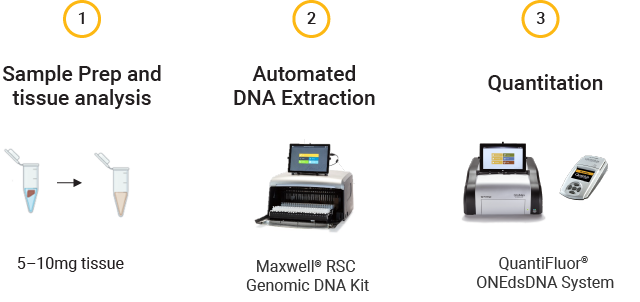
AAV in vivo biodistribution studies traditionally rely on genomic analysis, involving the extraction of genomic DNA from various animal tissues followed by qPCR or dPCR. However, this process is often labor-intensive and low-throughput.
Our automated DNA extraction and quantification solutions enable the detection and quantification of AAV viral genomes across multiple tissues. This streamlined workflow is fast (approximately 5 hours) and designed for high-throughput efficiency, saving you valuable time and resources.
To further simplify the workflow, we have developed an analysis software to automate custom data analysis and visualization. Download this flyer to learn more.
No Viral DNA Detected in Brain

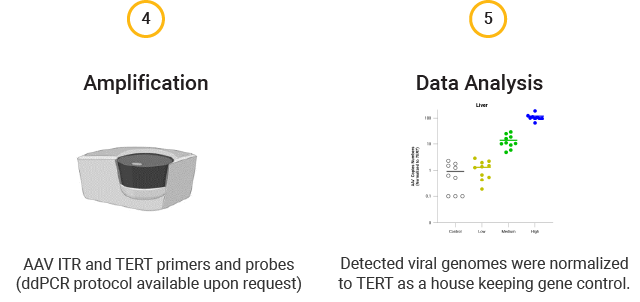
ddPCR results quantifying AAV copies in brain tissue. Mice were injected with varying levels of AAV9-NanoLuc®-HaloTag® viral particles. DNA was extracted from tissues collected 14 days post-injection. ddPCR amplification was performed using ITR and TERT (house-keeping gene control) primers and probes.
AAV Viral DNA Primarily Accumulated in Liver

ddPCR results quantifying AAV copies in liver tissue. Mice were injected with varying levels of AAV9-NanoLuc®-HaloTag® viral particles. DNA was extracted from tissues collected 14 days post-injection. ddPCR amplification was performed using ITR and TERT (house-keeping gene control) primers and probes.
Cell Tropism
Cell tropism determines which cell types a viral vector can effectively enter and deliver its genetic payload to. Understanding cell tropism allows you to choose vectors that enhance therapeutic efficacy, improve safety, and reduce the required dosage.
High-Throughput Evaluation of AAV Transduction
Transduction efficiency of AAV in different cell types is often assessed using fluorescent tags like GFP, followed by imaging and/or flow cytometry.
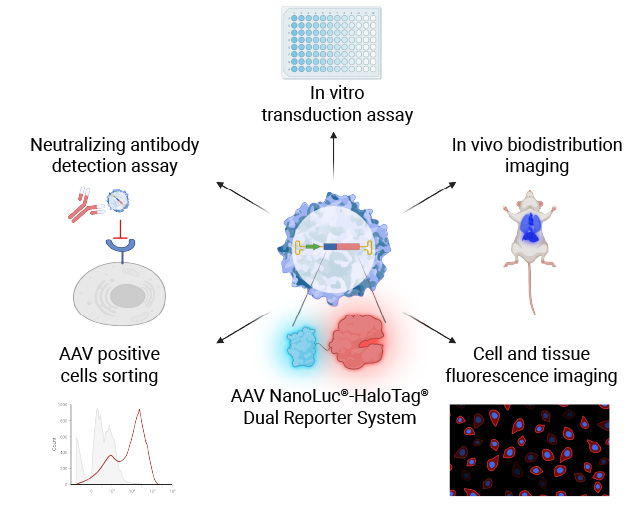
Our NanoLuc®-HaloTag® Dual Reporter AAV System is more sensitive and enables high-throughput, plate-based luminescence detection, while also supporting imaging and flow cytometry-based analysis. This provides a more robust and efficient solution for evaluating AAV transduction.
Contact us for information on purchasing the AAV dual reporter systems.
Measure In Vitro Cell Transduction (Infectivity)
Transducing cell lines with AAV NanoLuc®-HaloTag® reporter for each AAV serotype allows you to measure the selectivity of each AAV serotype for the cell line transduced.
If transduction is successful, the expressed NanoLuc® Luciferase will produce a luminescent signal in the presence of a substrate. The resulting luminescent signal intensity is proportional to the transduction efficiency of AAV.
NanoLuc® Luciferase Assay Workflow
The simplicity of the NanoLuc® Luciferase Assay workflow enables rapid, sensitive testing of cell tropism by AAV serotype.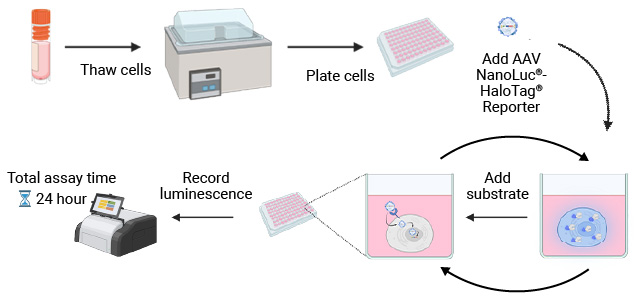
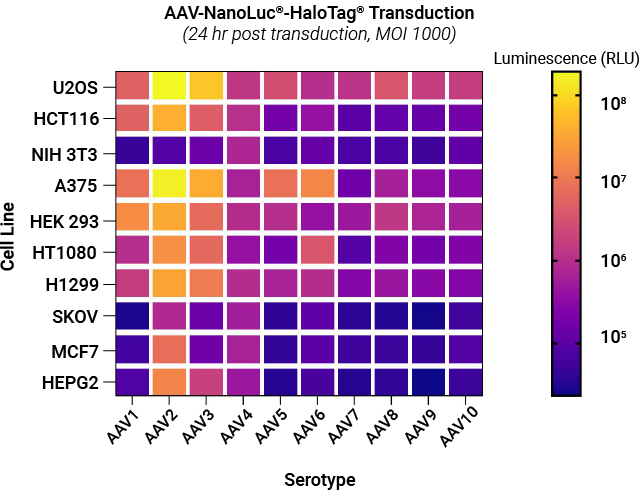
Selectivity of AAV NanoLuc®-HaloTag® reporters toward different cell lines. A panel of AAV NanoLuc®-HaloTag® reporters for AAV serotypes 1–10 were examined against a panel of cell lines representing different tissue types. Each cell type was transduced with reporters for each AAV serotype at MOI of 1,000. Following substrate addition, the luminescent signal produced by the infected cells expressing NanoLuc® luciferase was measured. The signal intensity is proportional to the transduction efficiency of AAV.
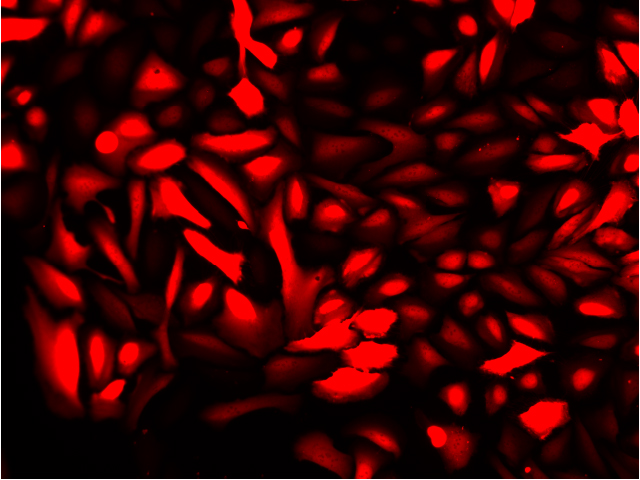
+ Janelia Fluor® HaloTag® 646 Ligand
Overlay with DNA Stain (Blue)
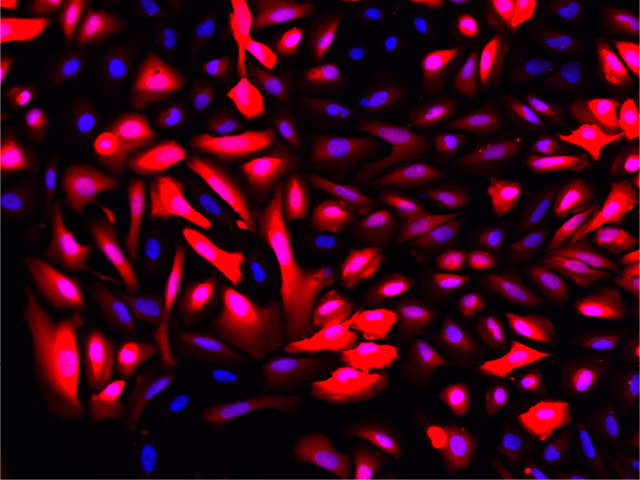
Fluorescence imaging of AAV infected cells. U2OS cells were transduced with an AAV2-NanoLuc®-HaloTag® reporter. Cells were incubated with Janelia Fluor® HaloTag® 646 Ligand 48 hours post-transduction. Images were taken using a Keyence microscope. Cells expressing HaloTag® proteins are in red and DNA stain are in blue.
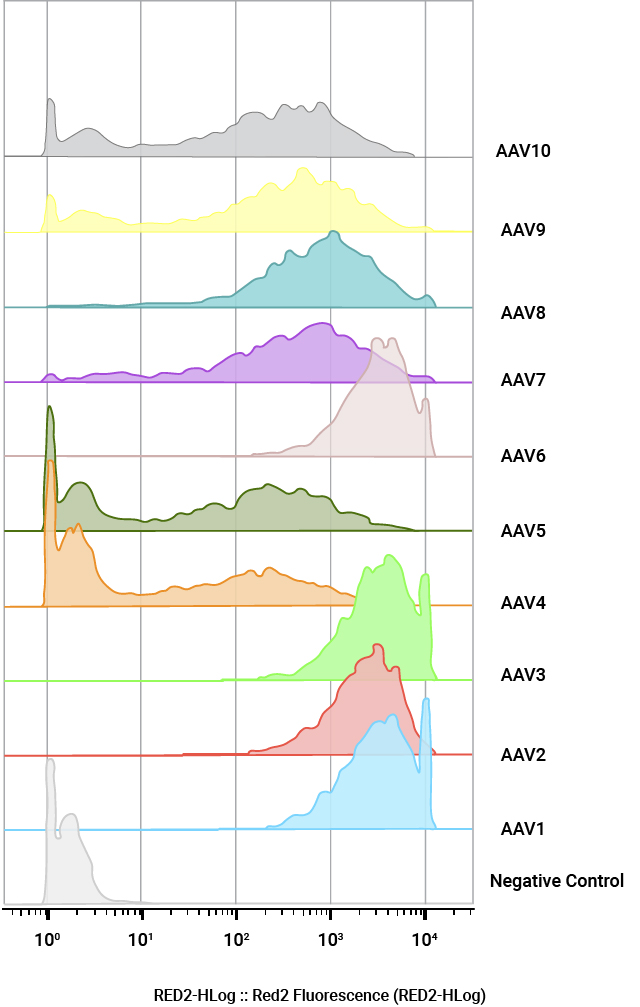
Quantification of AAV positive cells by flow cytometry. U2OS cells were infected with a panel of AAV NanoLuc®-HaloTag® reporters (AAV1–AAV10) at MOI of 100,000. Cells were labeled with Janelia Fluor® HaloTag® 646 Ligand 48 hours post-transduction and quantified by flow cytometry.
Peptide Mapping
Peptide mapping is often used to confirm the sequence and post-translational modifications of AAV capsid proteins. Due to the nature of AAV particles, it is challenging to get full sequence coverage using standard sample preparation protocols for protein analysis.
Sample Preparation of AAV Capsid Proteins
Our new Magnetic Proteomics Sample Prep (MPSP) Kit can be used in combination with our high-quality proteases for AAV capsid protein sample preparation. This multi-protease capsid mapping protocol allows near complete sequence coverage.
The MPSP beads offer efficient contamination removal, can denature substrates even under non-denaturing proteolysis conditions, and can help concentrate dilute samples for LC-MS/MS analysis.
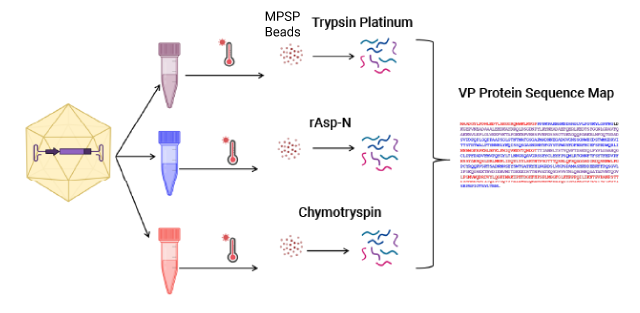
The MPSP Workflow for Capsid Proteolysis
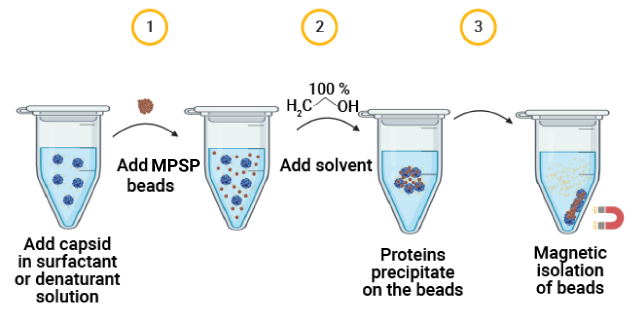
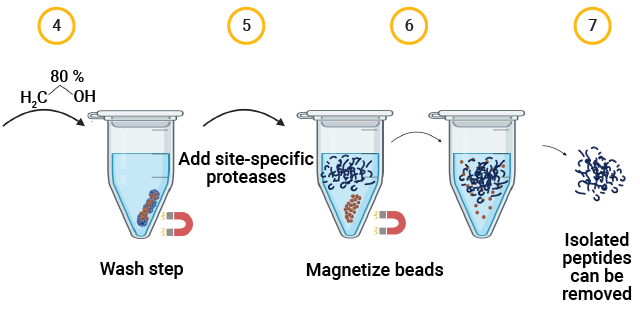
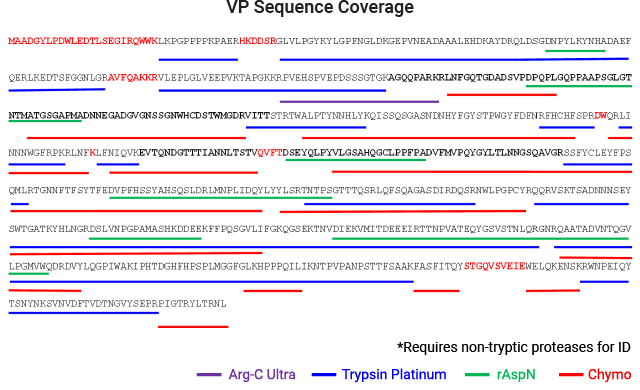
AAV capsid protein peptide mapping sequence coverage. Capsid protein was processed using the magnetic MPSP beads. Proteolysis was performed at low pH in AccuMAP™ 10X Low pH Reaction Buffer using Trypsin Platinum, Arg-C Ultra, rAsp-N and Chymotrypsin. E/S ratios were 1:25 and proteolysis was allowed to proceed for 18 hours at 37°C. Peptides were removed from the MPSP beads and desalted (C18) prior to LC-MS/MS on a Thermo Scientific Orbitrap Exploris™ 240 Mass Spectrometer interfaced with a Thermo NanoLC 1200 LC System.
Peptide Mapping Reagents for LC-MS Analysis of AAV Capsid Proteins
| Reagent |
Primary Utility |
Additional Information |
|---|---|---|
| Trypsin Platinum |
Capsid protein sequence mapping |
Recombinant Trypsin with very high cleavage specificity and stability |
| Arg-C Ultra |
Additional capsid protein coverage |
Arg-C proteinase with superior cleavage specificity and efficiency for mass spec |
| Chymotrypsin | Additional capsid protein coverage |
Needed to map acidic regions of capsid not covered by Trypsin |
| rAsp-N | Additional capsid protein coverage |
Needed to map regions of capsid not covered by Trypsin |
| Magnetic Proteomics Sample Prep (MPSP) Kit |
Key sample prep tool for protein capture and digestion |
Compatible with all surfactants and effective for enrichment of dilute protein (virus) solutions. |
| Rapid Trypsin/Lys-C |
Effective tool for mapping deamidation sites |
|
| PNGase F |
Critical for mapping glycosylation sites |
|
| AccuMAP® 10X Low pH Reaction Buffer |
Minimization of capsid protein deamidation |
Required for proteolysis prior to successful LC-MS/MS and peptide mapping analysis |