Getting the Best Results from Your Reverse Transcription Quantitative PCR Assay
Promega Corporation
Publication Date: 2012
Abstract
Reverse transcription quantitative PCR (RT-qPCR) combines two important processes in molecular biology research: reverse transcription, where reverse transcriptase converts RNA into DNA, and quantitative PCR, where the amount of amplified product is measured such that the amount of starting template can be determined. RT-qPCR is useful for quantifying low-copy-number RNA molecules, determining gene expression and studying the genomes of RNA viruses to name a few applications. Unlike RT-PCR, which is an endpoint assay, RT-qPCR takes measurements at every cycle and uses the data from the exponential phase, when reagents are not limiting, to quantify input template amount. This article describes the key considerations for the reverse transcription (RT) and qPCR portions of a RT-qPCR assay.
Introduction
RT-qPCR is a powerful tool for RNA analysis. It applies the power of PCR to an RNA sample by first reverse transcribing RNA into cDNA, then amplifying this cDNA template using PCR. RNA template quantity and purity and efficient reverse transcription are all important for successful RT-qPCR.
Following cDNA synthesis, qPCR is carried out using some form of fluorescent reporter to monitor the reaction. Using fluorescently labeled oligonucleotide probes or primers or fluorescent DNA-binding dyes to detect and quantitate a PCR product allows qPCR to be performed in real time. Specially designed instruments perform both thermal cycling to amplify the target and fluorescence detection to monitor PCR product accumulation. DNA-binding dyes are easy to use but do not differentiate between specific and nonspecific PCR products and are not conducive to multiplex reactions. Fluorescently labeled nucleic acid probes have the advantage that they react with only specific PCR products, but they can be expensive and difficult to design. Some qPCR technologies employ fluorescently labeled PCR primers instead of probes.
Methods
Parameters for Successful Reverse Transcription
RNA Purification
There are a number of parameters to consider when choosing an RNA extraction method. Although yield is often the primary consideration, genomic DNA (gDNA) removal and inhibitor carryover are also important. When you consider that qPCR detects molecules across a 106 fold range, a purification method with a twofold increase in yield but a lower purity doesn’t offer a real advantage. In fact, choosing a method that gives a higher yield but lower purity, especially with regard to gDNA carryover, can be a poor choice when the sample is intended for RT-qPCR. Even low amounts of gDNA contamination can cause variability in qPCR results, while high amounts of gDNA contamination can cause outright quantitation errors.
One way to help eliminate concerns about gDNA contamination is to include a DNase step in your RNA isolation method. A DNase treatment step can be added at the end of any method. In addition, a no-reverse transcriptase control should always be included in your experiment. Any amplification products from this control are due to the presence of gDNA, and you should assume that the same amount of gDNA is also present in the experimental samples.
Evaluating RNA Quality
Successful reverse transcription depends on RNA integrity and purity. There are several methods for evaluating your RNA before proceeding to the RT step. RNA integrity can be assessed qualitatively by gel electrophoresis or quantitatively using systems such as the Agilent Bioanalyzer, which uses microfluidics to size‐separate and quantitate RNA. If you are concerned about RNA degradation, be sure to follow procedures for creating and maintaining a ribonuclease‐free (RNase‐free) environment to minimize RNA degradation. A good description of these can be found in Blumberg, 1987 (1) . Using an RNase inhibitor (e.g., Recombinant RNasin® Ribonuclease Inhibitor) is strongly recommended.
RNA quantity and purity can be assessed by absorbance. Absorbance at A260 is used to determine RNA amount, and the ratio of absorbance at A260/A280 is used as a measure of purity. High‐quality RNA should have a minimum A260/280 ratio of about 2. Spiking experiments, in which RNA of unknown quality is added to an RT-qPCR that has amplified well in the past, can be used to detect inhibitors. It is a good idea to include a no-RT qPCR control reaction to detect gDNA contamination. Finally, quantifying the RNA will help normalize the amount of RNA you are including in each reaction.
RT Primers
There are three types of RT primers. The first primer anneals specifically to the poly(A) portion of the 3´-end of the transcript (oligo(dT) primer). Oligo(dT) primers can be problematic when your target region is at the 5´-ends of long mRNAs or when the molecules have significant secondary structure, which can cause the reverse transcriptase to stall during cDNA synthesis. The second type of primer is random hexamer primers. These can prime reverse transcription at multiple points along the transcript, and for this reason, they are useful for long mRNAs and transcripts with significant secondary structure. Gene-specific primers often are used in one-step (coupled) RT-PCR.
For RT-qPCR applications where the final amplicon length is about 100bp or less, using higher concentrations of random primers may be advantageous. You will have a higher probability of a priming event at the 3´ end of the mRNA, a greater chance of multiple cDNAs produced from each transcript and a higher probability of priming rare transcripts. Regardless of primer choice, the final primer concentration may need to be optimized.
One-Step versus Two-Step RT-PCR
RT-PCR can be performed using one of two strategies: one-step RT-PCR or two-step RT-PCR. The fundamental difference between these two approaches is whether the RT step is performed separately from the PCR or in the same tube. For one-step RT-PCR, the RT and PCR steps are performed sequentially in the same tube using the entire amount of the cDNA synthesis products as the template for PCR. For two-step RT-PCR, the RT and PCR steps are also performed sequentially, but only a portion of the cDNA products is used as a template for PCR, which is performed in a separate tube. For this reason, one-step RT-PCR may be the more sensitive approach. However, two-step RT-PCR allows multiple PCRs from a single RT reaction, which works well for quantifying multiple targets or for doing replicate assays.
One-step RT-PCR commonly uses gene-specific primers for both the RT and PCR steps, with one of the PCR primers also acting as the RT primer. Two-step RT-qPCR can use oligo(dT) primers or random primers for the RT step, but a sequence-specific primer also can be used.
Real-Time PCR Approaches
Fluorescent DNA-Binding Dyes
Using fluorescent DNA-binding dyes is one of the easiest qPCR approaches to detect amplicons in real time. The dye is simply added to the reaction, and fluorescence is measured at each PCR cycle. Because the fluorescence of these dyes increases dramatically in the presence of double-stranded DNA, DNA synthesis can be monitored as an increase in fluorescent signal. However, preliminary work often must be done to ensure that the PCR conditions yield only specific product. In subsequent reactions, specific amplification can be verified by a melt curve analysis. Thermal melt curves are generated by allowing all product to form double-stranded DNA at a lower temperature (approximately 60°C) and slowly ramping the temperature to denaturing levels (approximately 95°C). The product length and sequence affect melting temperature (Tm), so the melt curve is used to characterize amplicon homogeneity. Nonspecific amplification can be identified by broad peaks in the melt curve or peaks with unexpected Tm values. By distinguishing specific and nonspecific amplification products, the melt curve adds a quality control aspect during routine use. However, it is not possible to generate melting curves with assays that rely on the 5´→3´ exonuclease activity of Taq DNA polymerase, such as the probe-based TaqMan® technology.
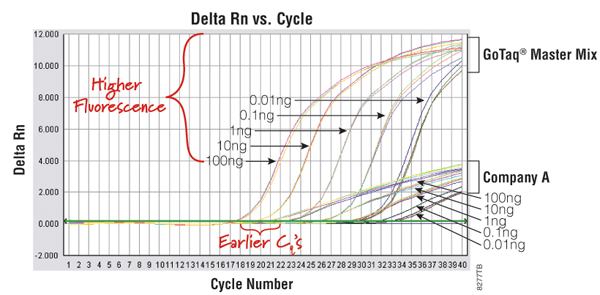
An example of a qPCR technology that uses a DNA-binding dye is the GoTaq® qPCR Master Mix (Cat.# A6001). This system contains a proprietary fluorescent DNA-binding dye that often exhibits greater fluorescence enhancement upon binding to double-stranded DNA and less PCR inhibition than the commonly used SYBR® Green I dye, while using the same filters and settings for detection. The dye is included in the GoTaq® qPCR Master Mix and does not inhibit amplification, resulting in earlier quantification cycle values and an expanded linear range (Figure 1). For more information, view the GoTaq® qPCR Master Mix video.
Labeled Primers or Probes
Real-time PCR using labeled oligonucleotide primers or probes employs two different fluorescent reporters and relies on energy transfer from one reporter (the energy donor) to a second reporter (the energy acceptor) when the reporters are in close proximity. The second reporter can be a quencher or a fluor. If the second reporter is a quencher, the energy from the first reporter is absorbed but re-emitted as heat rather than light, leading to a decrease in fluorescent signal. Alternatively, if the second reporter is a fluor, the energy can be absorbed and re-emitted at another wavelength through fluorescent resonance energy transfer (FRET, reviewed in Didenko, 2001 (2) ). During the exponential phase of PCR, the change in fluorescence is proportional to accumulation of PCR product. Different assay designs utilize quenching/dequenching or FRET in different ways to follow product accumulation. Some examples are presented below.
Primer-Based qPCR
One example of a primer-based approach is the Plexor® qRT-PCR Systems, which require two PCR primers, only one of which is fluorescently labeled. These systems take advantage of the specific interaction between two modified nucleotides (3) (4) (5) . The two novel bases, isoguanine (iso-dG) and 5´-methylisocytosine (iso-dC), form a unique base pair in double-stranded DNA (4) . To perform fluorescent quantitative PCR using this new technology, one primer is synthesized with an iso-dC residue as the 5´-terminal nucleotide and a fluorescent label at the 5´-end; the second primer is unlabeled. During PCR, this labeled primer is annealed and extended, becoming part of the template used during subsequent rounds of amplification. The complementary iso-dGTP, which is available in the nucleotide mix as dabcyl-iso-dGTP, pairs specifically with iso-dC. When the dabcyl-iso-dGTP is incorporated, the close proximity of the dabcyl quencher and the fluorescent label on the opposite strand effectively quenches the fluorescent signal. This process is illustrated in Figure 2. The initial fluorescence level of the labeled primers is high in Plexor® System reactions. As amplification product accumulates, signal decreases.

Probe-Based qPCR Methods
Some qPCR strategies employ complementary nucleic acid probes to quantify the DNA target. These probes also can be used to detect single nucleotide polymorphisms (6) (7) . There are several general categories of real-time PCR probes, including hydrolysis, hairpin and simple hybridization probes. These probes contain a complementary sequence that allows the probe to anneal to the accumulating PCR product, but probes can differ in the number and location of the fluorescent reporters. The use of simple hybridization probes involves two labeled probes or, alternatively, one labeled probe and a labeled PCR primer. In the first approach, the energy emitted by the fluor on one probe is absorbed by a fluor on the second probe, which hybridizes nearby. In the second approach, the emitted energy is absorbed by a second fluor that is incorporated into the PCR product as part of the primer. Both of these approaches result in increased fluorescence of the energy acceptor and decreased fluorescence of the energy donor.
Label-Based qPCR Methods
A benefit of the label-based methods over those using DNA-binding dyes is the capacity for multiplexing. While DNA-binding dyes are not sequence-specific, label‐based approaches are sequence‐specific because the fluorescent marker is on the amplification primer and only produces a strong signal when bound to the DNA target. The labeled primer can be tagged with one of many common fluorescent labels, allowing two- to four-color multiplexing, depending on the instrument used. This means that you can analyze both your target and control gene in the same well. Finally, the simplicity of primer design for the labeled primer-based method is a distinct advantage over probe-based quantitative PCR approaches.
Results
Analyzing RT-qPCR Results
The Amplification Curve
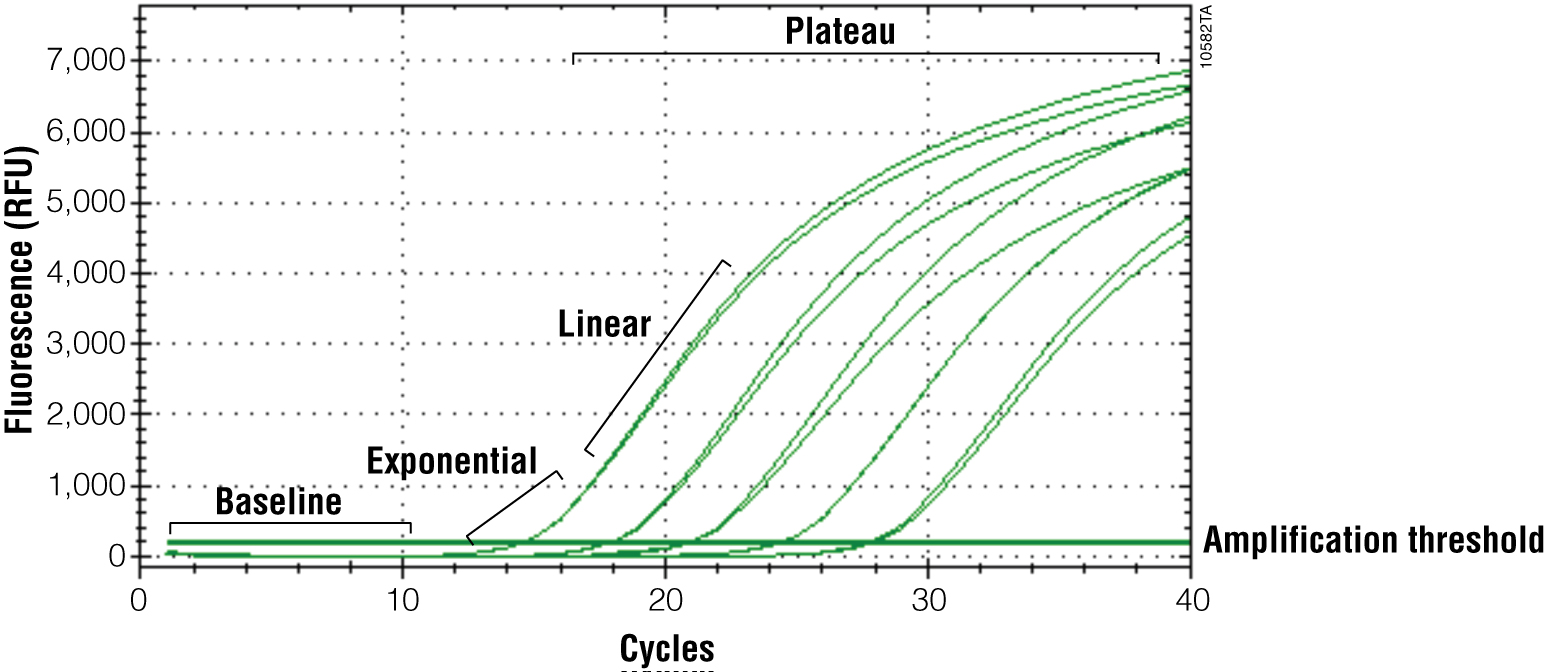
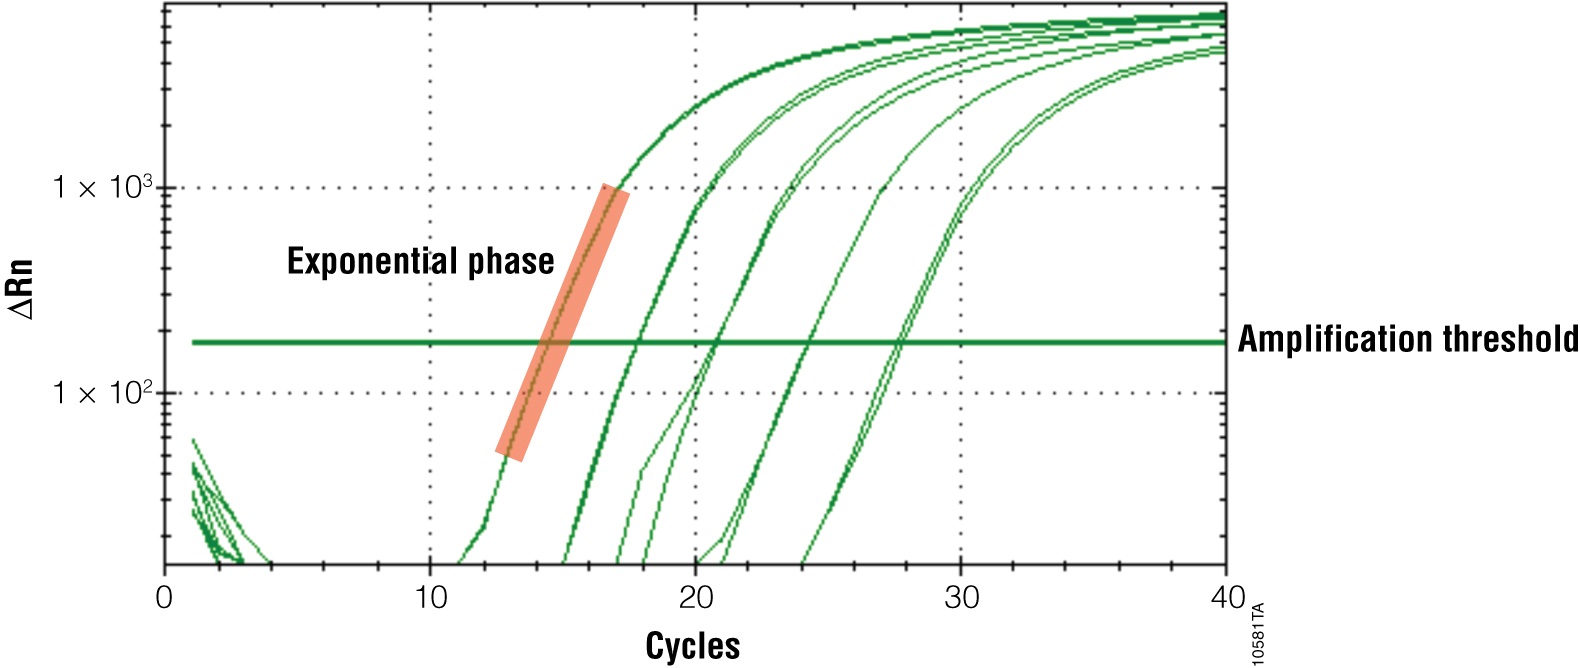
The primary output for qPCR (and RT-qPCR) is the amplification curve. These curves show the accumulation of amplified product as the reaction progresses. For fluorescent dye reporters this is measured as fluorescence (relative fluorescence units, RFU). There are three components of the amplification curve. The baseline is the fluorescence present from the reporter before amplification products begin to accumulate. The exponential phase is the stage of the reaction where the amount of product is doubling with each cycle. Eventually product formation will no longer be exponential, and the curve will flatten out or “plateau”. The cause of the plateau phase can be any number of things, including depletion of a reactant or product inhibition; however, this portion of the curve is not important for analysis. Only the exponential phase reflects an accurate and quantitative relationship between the signal and amount of starting template (Figures 3 and 4).
Adjusting your Software Output
All real-time PCR software performs certain analysis functions automatically including determining baseline regions, calculating the baseline correction and setting the amplification threshold. However, it is best to check what data the software uses to determine these values, and often you will need to specify or modify the criteria used so that you get the most accurate results. There are several things to consider when evaluating software’s automatic settings. Baseline regions are defined for each amplification curve. Baselines are important because they help set the amplification threshold, the point where the reporter signal is significantly higher than background levels (8) . Depending upon the sample type, you may want to adjust these so that all samples have the same baseline value. Baselines are important because amplification curves are corrected by substracting baseline values.
For accurate quantitation the threshold must be set so that all amplification curves cross this threshold while in the exponential phase; however, most software do not require amplification curves to cross the threshold in the exponential phase to calculate the quantification cycle, so you might have to set this manually.
Converting Cq to Template Quantity
The quantification cycle (Cq; also known as Ct) is the cycle number at which the amplification curve crosses the amplification threshold. Once you determine the Cq value, there are two approaches for converting that value to template quantity. In absolute quantification, the Cq value can be used to determine the amount of an unknown sample using a standard curve, where reactions contain a known amount of the target RNA. The standard curve is generated by plotting Cq versus concentration (log concentration) for the standard curve samples. The concentration of unknown samples then can be determined using an equation derived from the linear regression analysis of the standard curve.
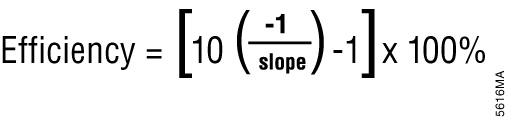
Relative quantification is based on the premise that each template is replicated with each cycle; therefore, n cycles would produce 2n product. This relationship also works in reverse so that two samples with a Cq difference of 1 would have a twofold difference in starting template. This approach assumes an amplification efficiency of 100 percent. Amplification efficiency is calculated using the equation shown in Figure 5 (9) . If the amplification efficiency is less than 100%, the calculation must be adjusted to correct for the decreased efficiency.
Summary
Successful RT-qPCR depends on the proper tools and techniques at each step of the process. Beginning with the RNA isolation technique and ending with the final analysis of the amplification curves, there are several things a researcher can do to ensure the best results. The RNA template should be of high quality and as free as possible of gDNA contamination. Depending on the final goal of the RT-PCR experiment, either one-step or two-step RT-qPCR can be performed. One-step RT-qPCR requires only one reaction setup and allows the reverse PCR primer to be used as the RT primer. However, one-step RT-qPCR uses the entire reverse transcription reaction for PCR. In two-step RT-qPCR, the RT step is performed first, then the cDNA product is used for real-time qPCR. In this approach, the products of one cDNA synthesis reaction can be used for multiple qPCRs.
Using fluorescent DNA-binding dyes is one of the simplest qPCR detection methods. The dye is added to the reaction, and as the dye binds to double-stranded DNA, the amount of fluorescence increases with each cycle. However, DNA-binding dyes are not sequence-specific, so care must be taken to ensure that the qPCR produces only the intended product. Label-based methods offer sequence-specific detection and the capacity to multiplex amplifications.
All real-time PCR software performs analysis of qPCR results automatically; however, you must check the analysis to ensure accurate results. Most importantly, the Cq must fall within the exponential phase of the reaction for reliable quantitation. Only the exponential phase reflects an accurate and quantitative relationship between the signal and amount of starting template. To emphasize the exponential phase, you can replot your amplification curve to a semi-log scale to help ensure that your final quantification values are accurate.
Related Protocol
References
- Blumberg, D.D. (1987) Creating a ribonuclease-free environment. Meth. Enzymol. 152, 20–4.
- Didenko, V. (2001) DNA probes using fluorescence resonance energy transfer (FRET): Designs and applications. Biotechniques 31, 1106–21.
- Sherrill, C.B. et al. (2004) Nucleic acid analysis using an expanded genetic alphabet to quench fluorescence. J. Am. Chem. Soc. 126, 4550–6.
- Johnson, S.C. et al. (2004) A third base pair for the polymerase chain reaction: Inserting isoC and isoG. Nucleic Acids Res. 32, 1937–41.
- Moser, M.J. and Prudent, J.R. (2003) Enzymatic repair of an expanded genetic information system. Nucleic Acid Res. 31, 5048–53.
- Lee, L.G., Connell, C.R. and Bloch, W. (1993) Allelic discrimination by nick-translation PCR with fluorogenic probes. Nucleic Acids Res. 21, 3761–6.
- Bernard, P.S., Lay, M.J. and Wittwer, C.T. (1998) Integrated amplification and detection of the C677T point mutation in the methylenetetrahydrofolate reductase gene by fluorescence resonance energy transfer and probe melting curves. Anal. Biochem. 255, 101–7.
- Gibson, U.E., Heid, C.A. and Williams, P.M. (1996) A novel method for real time quantitative RT-PCR. Genome Res. 6, 995–1001.
- Bustin, S.A. (2002) Quantification of mRNA using real-time reverse transcription PCR (RT-PCR): Trends and problems. J. Mol. Endocrinol. 29, 23–39.