Internal Validation and Implementation of the PowerPlex® Y23 System in a Casework Laboratory
Wisconsin Crime Laboratory Bureau, Madison1 and Milwaukee2, Wisconsin
Publication Date: 2014
Introduction
The Wisconsin Crime Laboratory Bureau (WI CLB) has been performing Y-STR analysis since 2004 using the Promega PowerPlex® Y System. In early 2013, Promega announced that production of the PowerPlex® Y System would cease after December 31, 2013, thereby necessitating validation of a new Y-STR amplification kit for use in casework at the WI CLB. We conducted the following internal validation of the PowerPlex® Y23 System as required by the FBI Quality Assurance Standards following the outline provided in SWGDAM’s Validation Guidelines for DNA Analysis Methods (1) .
Y-STR analysis is a necessary tool in forensic casework, particularly in sexual assault and homicide cases, when probative autosomal profiles are not obtained but a trace male component is detected. Additionally, Y-STR analysis can further support autosomal mixtures that have a trace male contributor. Because Y-STR analysis specifically targets male DNA, it is extremely useful for analysis of intimate samples that have a high amount of female DNA relative to the amount of male DNA (e.g., intimate swabs collected from a female sexual assault victim that are negative for sperm). Furthermore, due to the highly sensitive nature of Y-STR analysis it has great utility in analysis of cold cases in which the quantity of DNA obtained may not be sufficient for autosomal STR analysis.
The reasons for selecting the PowerPlex® Y23 System as the kit for validation by WI CLB were multifaceted. The PowerPlex® Y23 System has the greatest number of genetic markers currently available in a single kit. This kit combines the 17 Y-STR loci found in current commercially available kits with six additional Y-STR loci (DYS481, DYS533, DYS549, DYS570, DYS576 and DYS643) (2) . These six additional loci are reported to be highly discriminating with high gene diversity, facilitating greater distinction between unrelated males. Two of the six added loci (DYS570 and DYS576) have reported mutation rates >1%, providing an increased possibility of distinguishing between paternally related males (2) . Because the WI CLB has used the PowerPlex® Y System since 2004 and currently uses the PowerPlex® 16 HS System for autosomal STR analysis, we anticipated that integrating the PowerPlex® Y23 System into established laboratory workflow would be relatively seamless. In addition, implementation did not require any equipment upgrades.
The WI CLB currently employs 59 casework DNA analysts located at laboratories in Madison and Milwaukee; all DNA analysts are proficient in both autosomal and Y-STR DNA analysis. In 2013, Y-STR analysis was performed on over 400 cases, with more than 1,300 evidence and standard samples amplified. The WI CLB currently uses the Quantifiler® Human DNA Quantification Kit and Quantifiler® Y Human Male DNA Quantification Kit (Applied Biosystems) for quantitation. If the ratio of total human DNA to male DNA is less than 20:1, autosomal STR analysis is attempted. However, if the ratio of total human DNA to male DNA exceeds 20:1 or the male quantitation value exceeds 0.0013ng/µl, samples are typically amplified with the PowerPlex® Y System (as case specifics warrant). In addition, our protocols define that all samples that test positive for semen (either p30 or microscopic identification) but yield negative male quantitation results must be amplified and typed for Y-STRs if no other positive semen stains provide an interpretable autosomal or Y-STR DNA profile.
The internal validation of the PowerPlex® Y23 System was performed by a team consisting of two DNA analysts from each laboratory in conjunction with the Technical Unit Leaders. Studies were conducted in tandem at each laboratory site. Data generated at each laboratory were compared and compiled. This allowed us to examine possible site-to-site variability and establish bureau-wide analysis parameters and interpretation guidelines governed under a unified policy and procedure manual.
Materials and Methods
Sample Preparation: Buccal swabs from individuals contributing to the validation study were extracted using either the DNA IQ™ System (Promega) (initial typing and concordance) or organic extraction and Microcon® DNA Fast Flow filter concentrators (all other studies). Samples were quantified (typically in triplicate) with Quantifiler® Y Human Male DNA Quantification Kits and averaged. Mock-case type samples were extracted via organic extraction and filter concentrators and quantified using Quantifiler® Human DNA Quantification Kit and/or Quantifiler® Y Human Male DNA Quantification Kit as appropriate.
Amplification and Genetic Analyzer Setup: All samples were amplified using the Promega PowerPlex® Y23 System and an Applied Biosystems GeneAmp® PCR System 9700 thermal cycler using the amplification parameters and volumes recommended in the PowerPlex® Y23 System Technical Manual (3) . Amplification setup was performed using a Tecan Freedom EVO® 100 Automation System integrated with BEAST LIMS (Porter Lee). Capillary electrophoresis and fragment detection were subsequently performed on an Applied Biosystems® 3130xl Genetic Analyzer using the recommended procedures and modules outlined in the PowerPlex® Y23 System Technical Manual (3) . Modules for 2-, 5- and 10-second injection times at 3kV and a 1,500-second run time were used to generate all data. Data analysis was performed using GeneMapper® ID software, version 3.2.1 (Applied Biosystems).
Results
Initial Typing, Concordance and Sample Selection
Buccal swabs from 35 male volunteers were amplified one time each with the PowerPlex® Y23 System targeting 0.5ng template DNA. The PowerPlex® Y23 profiles developed were 100% concordant with previously characterized PowerPlex® Y profiles at common loci. Interestingly, one male known to have a null allele at DYS19 when amplified with PowerPlex® Y was also null at DYS19 when amplified with PowerPlex® Y23. Pair-wise comparisons of the 35 PowerPlex® Y23 profiles were performed. These comparisons facilitated selection of the males that were used in all additional studies. Males whose PowerPlex® Y23 haplotypes were most genetically distinct from one another were selected to be used in both sensitivity and mixture studies. This step was critical for gaining the most information possible, particularly from the mixture studies.
Single-Source Studies
DNA from the buccal swabs of five males was normalized to target the following template amounts: 0.01ng, 0.025ng, 0.0375ng, 0.05ng, 0.075ng, 0.1ng, 0.25ng, 0.375ng, 0.5ng and 0.75ng. All samples were amplified in triplicate. Samples with template between 0.01ng and 0.075ng were injected for 5 and 10 seconds, and samples with template values of 0.1ng to 0.75ng were injected for 2 and 5 seconds. All single-source data were managed using Microsoft Access® software and exported into Microsoft Excel® for further analysis.
The data generated from single-source samples were used to determine the analytical threshold, optimum and minimum template input values, and stutter percentages. Average allele peak heights in relative fluorescent units (RFU) values for each locus and template concentration were calculated. Furthermore, each sample replicate was evaluated for the presence of two alleles at DYS385, and the respective peak height ratios (PHR) were determined. Non-stutter artifacts were noted, and precision, reproducibility and contamination requirements were also addressed.
Laboratory Detection Threshold
To determine the analytical threshold or laboratory detection threshold (LDT), reagent blanks, negative controls and samples with target values of 0.01ng to 0.075ng, injected for 5 and 10 seconds, were analyzed with the peak amplitude threshold set at 1RFU. True alleles, stutter and known artifacts were removed, and RFU values were averaged. Average RFU values were consistent between all dye channels. The averages + 10 standard deviations were approximately 20–50RFU. We selected and applied 50RFU as the LDT in all subsequent studies.
Minimum and Optimum Target DNA Input
Each sample was evaluated for the presence of an allele at or above the LDT of 50RFU at each locus and the presence of two alleles at DYS385. Peak height ratios at DYS385 were also calculated. A heat map was generated to help visualize the data and examine trends. Data from samples with inputs of 0.05ng and above generally produced balanced and complete profiles with minimal dropout. Even at 0.0375ng input, the vast majority of samples exhibited nearly complete profiles with some full profiles observed. The average RFU value for alleles at this target input was approximately 175RFU. At 0.025ng and 0.01ng template quantities, increased allelic dropout was observed along with a significant increase in stochastic effects. A minimum amplification cutoff of 0.0375ng was determined based on these results. Analysis of the data generated indicated that 0.5ng target input was optimal, providing the best balance between developing robust peak heights (average of 1,800RFU for a 5-second injection) and minimizing potential artifacts for single-source samples. Interlocus dye balance was also examined. Overall, samples had excellent interlocus dye balance both within a dye channel as well as across all loci in a profile at and above a template input of 0.0375ng (Figure 1). The interlocus dye balance observed with the PowerPlex® Y23 System was significantly improved over that typically observed with the PowerPlex® Y System for single-source, non-compromised samples.
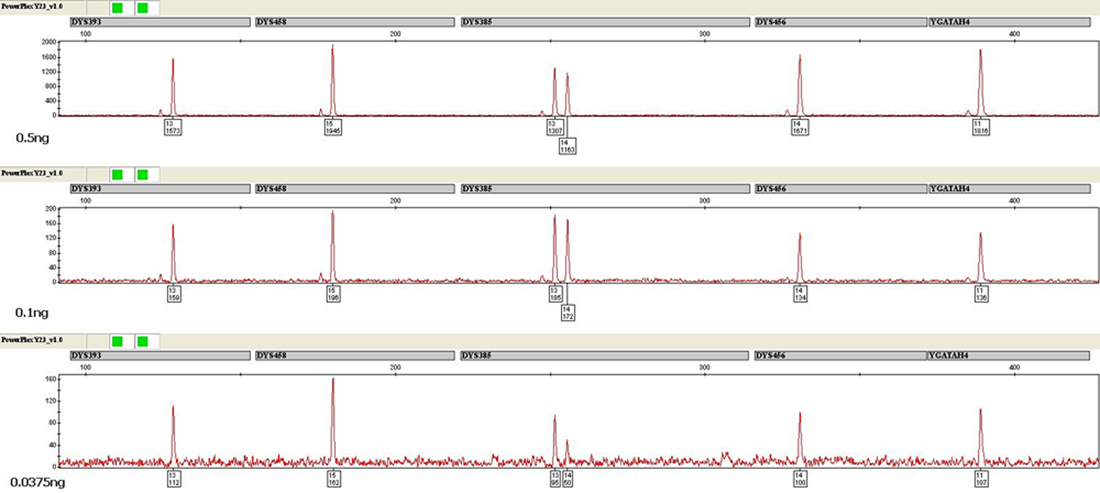 Figure 1. Amplification of 0.5ng (top), 0.1ng (middle) and 0.0375ng (bottom) of male DNA using the PowerPlex® Y23 System. One microliter of amplified product was separated using an Applied Biosystems® 3130xl Genetic Analyzer and a 3kV, 5-second injection. The CXR-ET dye channel is shown.
DYS385 in Single-Source Samples
The average PHR for DYS385 across all input template quantities was approximately 77%. When the optimum input amount of 0.5ng was targeted, the average PHR was 85% and the average PHR minus 3 standard deviations was 51%. Therefore, a PHR of ≥50% at DYS385 was selected for profile interpretation. Each sample replicate was evaluated for the presence of two alleles, loss of a single allele or loss of both alleles at DYS385. A heat map was generated to help visualize data. Dropout of one or two alleles at DYS385 was more frequently observed at or below 0.025ng input. The maximum peak height of a false single allele for a 5-second injection was 231RFU (0.0375ng), and for a 10-second injection the value was 306RFU (0.01ng).
Stutter and Artifacts
Minus stutter was assessed for all single-source data generated. The mean stutter percentage plus 3 standard deviations was calculated for each locus and compared to marker-specific stutter percentages provided as default values in the PowerPlex® Y23 panels. In all but five instances (DYS19, DYS458, DYS635, DYS643 and DYS385), internally validated values were at or below these default values. The greater of the two values was selected as the minus stutter percentage for use at the WI CLB. These stutter percentages were applied during all subsequent studies. Plus stutter was evaluated in a similar manner. With the exception of DYS392, minimal plus stutter was observed. In mixture studies (discussed below), additive effects of plus and minus stutter were noted in some profiles. DYS19 showed n–2 and n+2 stutter artifacts, and these were more prevalent in samples with a relatively high template amount and/or a longer injection time.
Precision, Reproducibility and Contamination
Precision of the PowerPlex® Y23 System was calculated using 23 PowerPlex® Y23 allelic ladders. The minimum, maximum, average and standard deviation values of the base pair sizes were calculated for each allele at each locus. A high level of precision was observed in the sizing of the alleles, with all alleles sizing within ±0.5 base pairs among all ladder injections on each Applied Biosystems® 3130xl Genetic Analyzer used in this validation. Each single-source sample replicate (at the optimal target of 0.5ng) and all positive controls produced the expected and complete DNA profiles with different operators in different laboratories, demonstrating that the system is reproducible. Negative controls and reagent blanks were amplified along with samples and found to be free of contaminants.
Mixture Studies
Two-Person and Three-Person Mixture Studies
Two different pairs of males (sharing DNA types at only one or two loci) were used for two-person mixture studies. Each two-person mixture was combined in the following ratios: 1:2, 1:3, 1:5, 1:7 and 1:10. All mixtures were amplified in duplicate, targeting 0.0375ng, 0.1ng and 0.5ng. At a ratio of 1:2, regardless of input DNA quantity, the major contributor could not be determined conclusively at most locations, with PHRs at some loci between 70% and 90%. However, at a 1:3 ratio and 0.1ng input, the distinction between major and minor contributors was observed in most samples. For ratios of 1:5 and above, all template input quantities resulted in a high level of major/minor separation at most locations. Furthermore, all data were examined for the presence of major/minor inversion. Very few instances of this major/minor inversion were observed, and those that were noted were primarily at 1:2 and 1:3 ratios and/or 0.0375ng input. PHRs for the inversions were roughly 30–45%.
Two combinations of three different males were used for three-person mixture studies. Each three-person mixture was combined in 5:1:1 and 10:4:1 ratios and amplified in duplicate at 0.0375ng, 0.1ng and 0.5ng. In addition to examining the profiles for the presence of major/minor inversion, we used these mixtures to assess previously established Y-STR mixture interpretation guidelines with the PowerPlex® Y23 validation-defined parameters (see below).
Laboratory Interpretation Threshold
Data obtained from single-source and two-person mixture studies were used to determine the stochastic threshold or laboratory interpretation threshold (LIT). LIT was based on a combination of the average peak heights observed at the minimum input template (0.0375ng), the maximum peak height of false single alleles at DYS385 and the approximate RFU values where major/minor inversion was observed in the two-person mixture study. A LIT of 250RFU for 2- and 5-second injections and 300RFU for 10-second injections was selected for use in profile interpretation.
The WI CLB PowerPlex® Y mixture interpretation guidelines were used as a framework and were modified using the PowerPlex® Y23-validated parameters. These guidelines then were applied to all of the two- and three-person mixture profiles to ascertain applicability. For all loci with the exception of DYS385, if the sum of the allele peak heights for the smaller alleles was ≥45% of that of the tallest allele, a major contributor at that locus was not assigned. For DYS385, the PHR of the two tallest alleles must be ≥50% and the sum of the allele peak heights for the smallest alleles must be ≤45% for a major contributor to be determined. Additional mixture interpretation rules apply for DYS385, depending on the number of alleles observed. The mixture interpretation guidelines were successful in correctly identifying the correct major contributor profile when applied to the two- and three-person mixture profiles.
Case-Type Samples
To ensure that the PowerPlex® Y23 System maintains sensitivity in the presence of excess female DNA, mimicking what is encountered in forensic casework, 0.0375ng of purified male DNA was amplified in the presence of >2,400ng of female DNA extracted from vaginal swabs. PowerPlex® Y23 profiles developed in the presence of excess female DNA exhibited similar allele peak heights as those developed from purified male DNA alone (Figure 2). However, non-stutter artifacts were noted in some female/male samples with peak heights at or above those of the known alleles of the input male. In the same way, DNA was extracted from rectal swabs collected by female volunteers and amplified using 0.0375ng of purified male DNA. PowerPlex® Y23 profiles with comparable peak heights were developed regardless of the presence of female DNA, with additional artifacts observed with these samples as well. The WI CLB has noted similar non-stutter artifacts with casework samples amplified with the PowerPlex® 16 HS System, which uses an analogous buffer system. Additional studies with case-type samples are ongoing to further assess non-stutter artifacts.
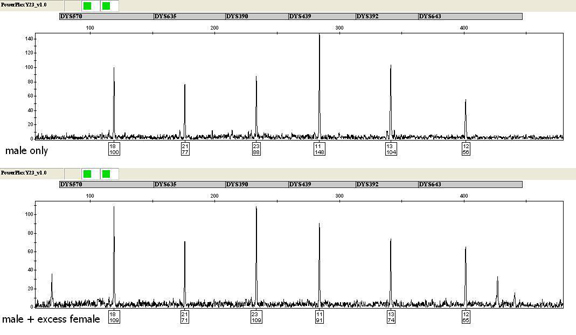 Figure 2. Amplification of 0.0375ng of male DNA (top) and a male/female mixture sample containing 0.0375ng of male DNA and >2,400ng of female DNA (~65,000-fold excess) using the PowerPlex® Y23 System. One microliter of amplified product was separated by capillary electrophoresis using an Applied Biosystems® 3130xl Genetic Analyzer and a 3kV, 5-second injection. The TMR-ET dye channel is shown.
In addition, a vasectomized-male post-coital time course collected by a female volunteer was studied. A complete PowerPlex® Y23 profile was detected at 12 hours post-coitus (0.37ng target input), and at 18 hours, alleles were detected at 16 loci (target input of 0.01ng). At 36 hours, no male DNA was detected with the Quantifiler® Y Human Male DNA Quantification Kit; however, alleles were still detected at 6–10 loci, demonstrating the sensitivity of the PowerPlex® Y23 System. Due to the number of non-stutter artifacts observed, further studies are warranted and ongoing.
Moving Forward
One of the biggest challenges that remains to be addressed prior to implementation of the PowerPlex® Y23 System is regarding statistical calculations for PowerPlex® Y23 profiles. Currently, the WI CLB uses the US Y-STR database to report Y-STR statistics. As of February 2014, the US Y-STR database size for a complete 12-locus PowerPlex® Y profile is 29,904 individuals. The database size for a complete PowerPlex® Y23 profile is only 4,838 individuals. Because the statistic changes as the database size increases, this presents a slight discrepancy from the typical Y-STR statistic that is currently reported. For example, if the selected 12-locus haplotype is found in 0 of 29,904 individuals, the frequency (applying the 95% upper confidence interval) is 1 in every 10,000 individuals. However, if that same individual’s 23-locus PowerPlex® Y23 haplotype is searched, it is found in 0 of 4,838 individuals with a frequency (when applying the 95% upper confidence interval) of 1 in every 1,616 individuals. Until the database for complete PowerPlex® Y23 haplotypes is sufficient in size, new guidelines will have to be implemented for how the WI CLB will report Y-STR statistics.
Conclusions
Overall, the PowerPlex® Y23 System is a sensitive and robust kit for use in forensic casework as a replacement for the PowerPlex® Y System. The improved and consistent interlocus dye balance observed will be of great benefit in Y-STR mixture interpretation. The increased power of discrimination due to the expansion of the number of loci examined will reduce the occurrence of adventitious matches for Y-STR haplotypes developed in casework.
Further case-type sample and artifact studies are ongoing. Additionally, the WI CLB procedure manual is being updated to incorporate PowerPlex® Y23 parameters and interpretation guidelines. Prior to implementation of the PowerPlex® Y23 System, all casework DNA analysts will be issued a competency test.
Acknowledgements
Many thanks to Nicole Hinton for her assistance with the laboratory testing and evaluation of PowerPlex® Y23 data.
Related Products
Article References
- Scientific Working Group on DNA Analysis Methods Validation Guidelines for DNA Analysis Methods.
- Thompson, J.M. et al. (2013) Developmental validation of the PowerPlex® Y23 System: A single multiplex Y-STR analysis system for casework and database samples. Forensic Sci. Int. Genet. 7, 240–50.
How to Cite This Article
Scientific Style and Format, 7th edition, 2006
Buscher, A. et al. Internal Validation and Implementation of the PowerPlex® Y23 System in a Casework Laboratory. [Internet] 2014. [cited: year, month, date]. Available from: https://www.promega.com/resources/profiles-in-dna/2014/internal-validation-and-implementation-of-the-powerplex-y23-system-in-a-casework-laboratory/
American Medical Association, Manual of Style, 10th edition, 2007
Buscher, A. et al. Internal Validation and Implementation of the PowerPlex® Y23 System in a Casework Laboratory. Promega Corporation Web site. https://www.promega.com/resources/profiles-in-dna/2014/internal-validation-and-implementation-of-the-powerplex-y23-system-in-a-casework-laboratory/ Updated 2014. Accessed Month Day, Year.
Contribution of an article to Profiles in DNA does not constitute an endorsement of Promega products.
PowerPlex is a registered trademark of Promega Corporation. DNA IQ is a trademark of Promega Corporation.
Access and Excel are registered trademarks of Microsoft Corporation. Applied Biosystems, GeneAmp, GeneMapper and Quantifiler are registered trademarks of Applied Biosystems. Freedom EVO is a registered trademark of Tecan AG Corporation. Microcon is a registered trademark of Millipore Corporation.