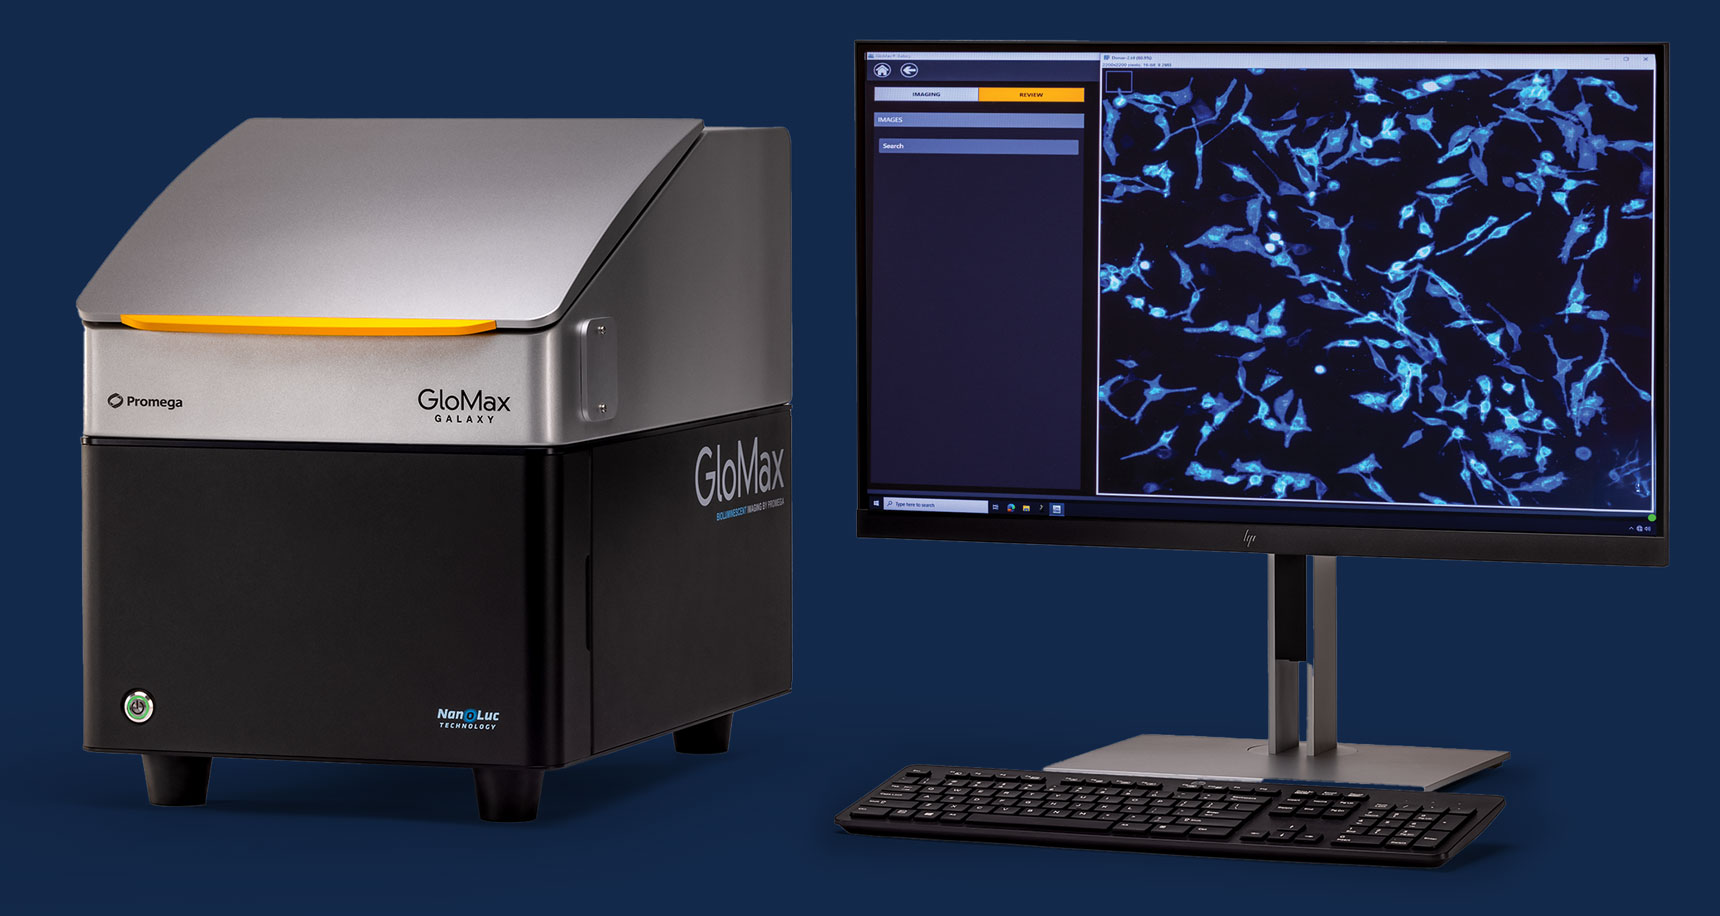
Proven GloMax® Galaxy Bioluminescence Imaging Applications
From protein interactions to cell killing assays, the GloMax® Galaxy Bioluminescence Imager* brings your NanoLuc-based experiments to life.
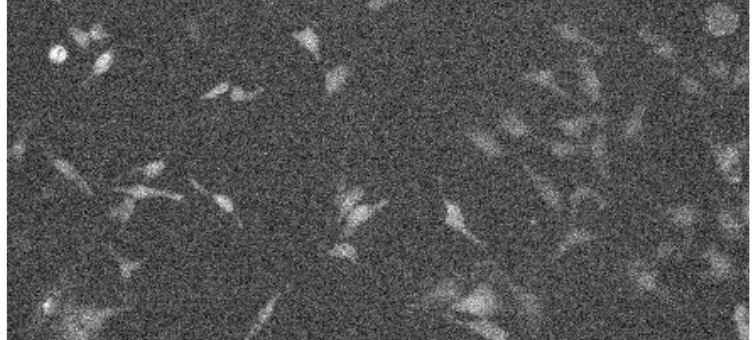
Protein Translocation
Visualize EGFR Internalization in Real Time
Use bioluminescence imaging to visualize HiBiT-tagged EGFR after EGF stimulation, complementing plate-based assays with single-cell spatial resolution.
Targeted Protein Degradation
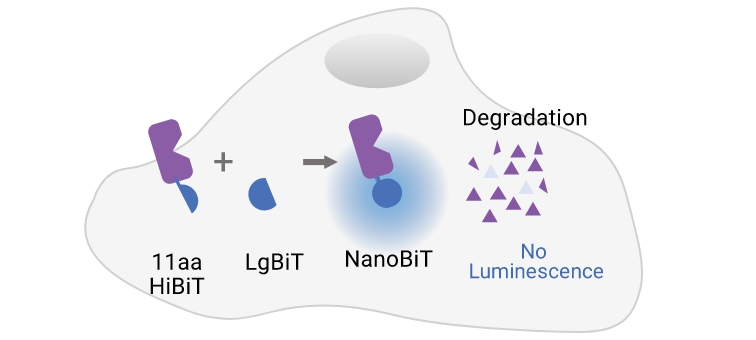
Visualize GSPT1 Protein Degradation
Monitor HiBiT-GSPT1 degradation in HEK293 cells using bioluminescent imaging; complements plate-based assays by confirming single-cell degradation patterns.
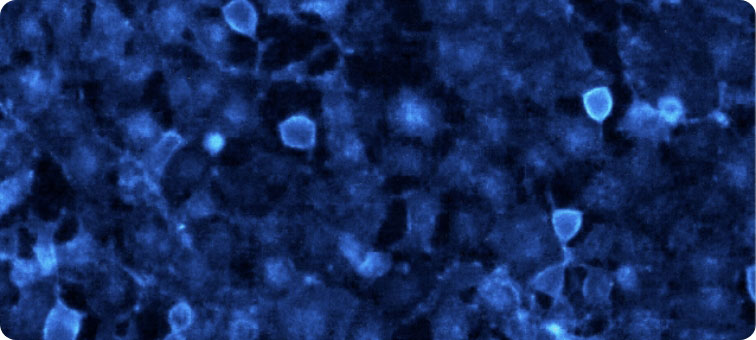
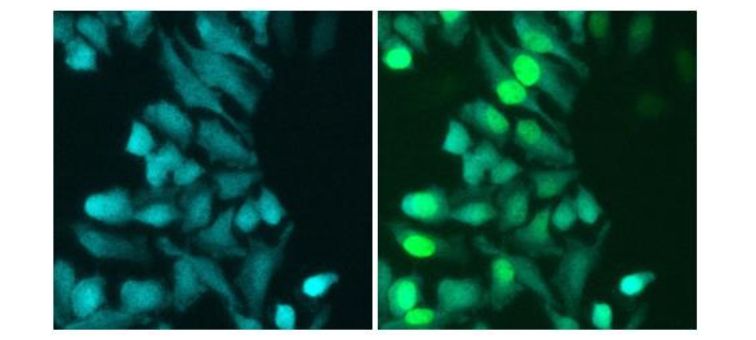
Protein Translocation
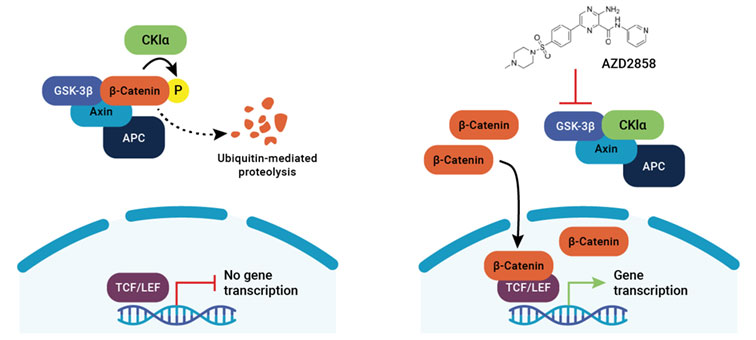
Track β-Catenin Stabilization in Live Cells
Image HiBiT assays to visualize nuclear accumulation of β-catenin following inhibitor treatment.
Target Engagement
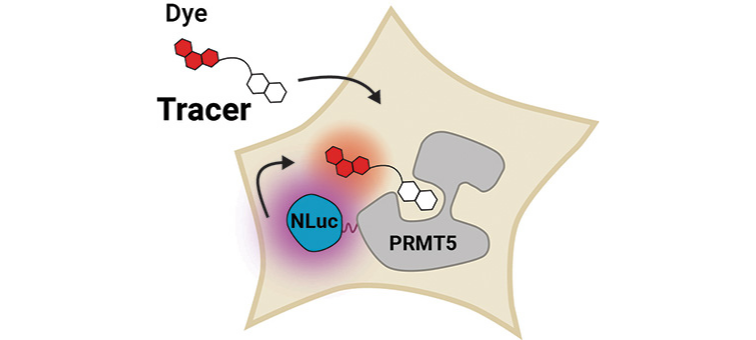
Image PRMT5-MTA Complex
Protein:Protein Interactions
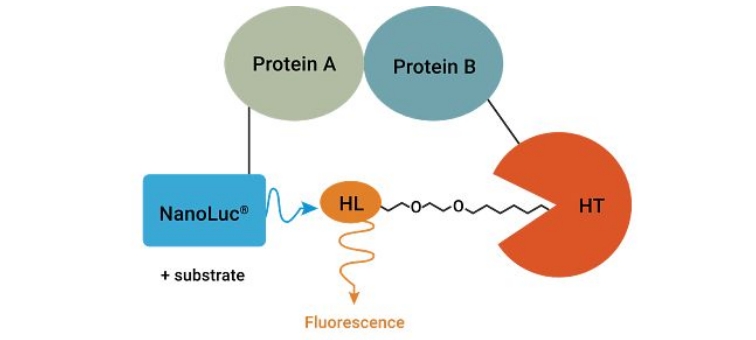
Visualize KRAS-CRAF Interaction Dynamics
Use NanoBRET® assays to visualize KRAS(G12D):CRAF interactions. BRET signal shifts after inhibitor treatment, confirming disruption of protein interaction and complementing plate-based analysis.
Protein:Protein Interactions
Visualize GPCR-Arrestin Interaction
Visualize protein:protein interactions via NanoBiT® signal from CX3CR1–ARRB2 interaction in HEK293 cells. Imaging confirms receptor internalization and complements plate-based PPI assays.
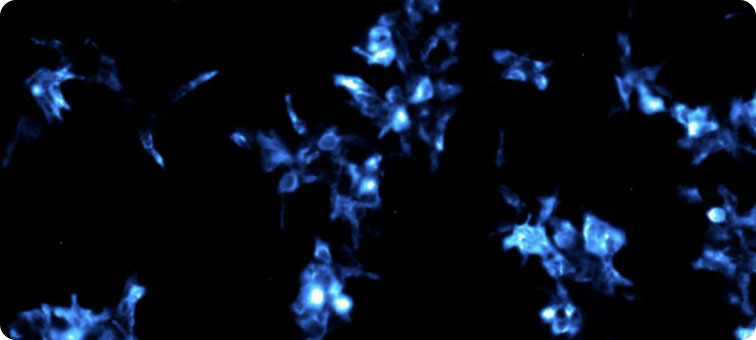
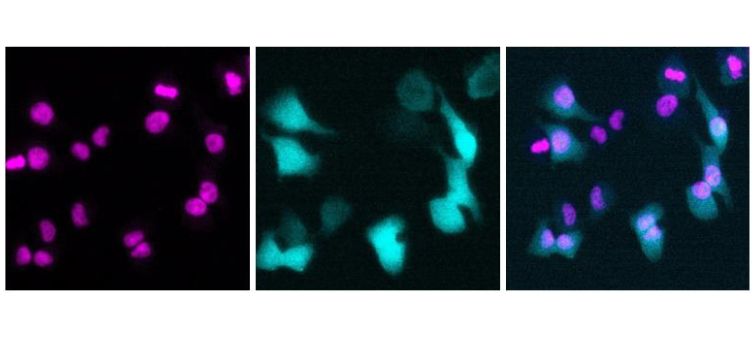
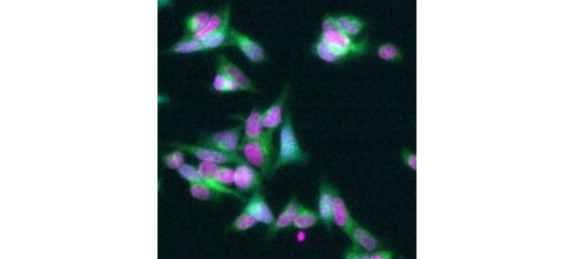
Cell Staining
Fluorescence Nuclei Staining and Co-Imaging with NanoLuc® Luciferase
Visualize nuclear staining in fixed or live cells using NucSpot® Live 488 and co-image with NanoLuc® technology on the GloMax® Galaxy Bioluminescence Imager.
Cell Staining
Far-Red Fluorescence Nuclei Staining and Co-Imaging with NanoLuc® Luciferase
Use NucSpot® Live 650 to visualize nuclei in fixed or live cells with NanoLuc® technology.
General / Compatibility Testing
Evaluate Imaging Performance with the GloMax® Galaxy Test Slide
Demonstrate brightfield, fluorescence and luminescence capabilities of the GloMax® Galaxy Bioluminescence Imager using a pre labeled, fixed HeLa test slide expressing NanoLuc®-HaloTag® reporters. Includes reagents and imaging guidance to help validate instrument performance and user workflow.
Target Engagement
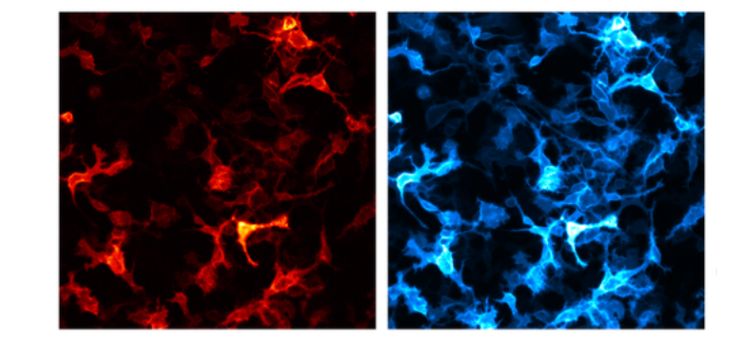
Image NanoBRET® Target Engagement in Live Cells
Quantify protein:small molecule binding by imaging NanoBRET® signals on the GloMax® Galaxy. This workflow demonstrates exposure optimization, dynamic range improvement and ratiometric analysis using GPCR targets HTR2A and HTR2C in live cells.
3D Model Imaging
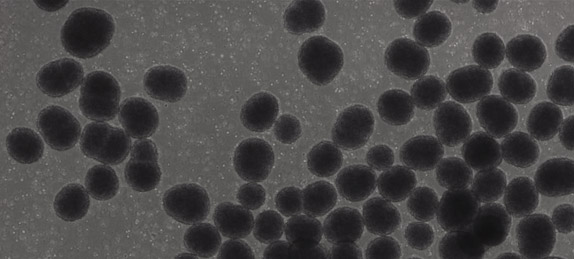
Imaging 3D Models
General / Cell Staining
Enhancing Luminescent Imaging with Fluorescent Staining
*The GloMax® Galaxy Bioluminescence Imager is for research use only.