Choosing the Right Method for Nucleic Acid Quantitation
Adam Blatter Promega Corporation
Publication Date: March 2018; tpub_196
Abstract
Nucleic acid quantitation is a critical step in sample preparation that helps ensure optimal performance of downstream assays. A common misconception is that all quantitation methods are alike and have similar accuracy. But in fact, concentration estimations can differ depending on what method is used. Thus, it is crucial to understand the basis of each method so you can choose the most suitable one for your need. This article describes the principles, advantages and limitations of the three most common methods for DNA or RNA quantitation: spectrophotometry, fluorescence and real-time PCR.
Introduction
With the growing breadth and capability of advanced assays now available to scientists, the progress of genomics research is becoming limited less by the available tools of molecular biology, and more by the questions to which they are answering. Progress in applications such as genotyping, copy number variation (CNV) analysis, pathogen identification, gene expression analysis, biomarker discovery, cytogenetic and molecular oncology profiling, have been advanced by continued improvements in technologies such as qPCR, microarrays and sequencing.
There are numerous components of the sample preparation workflow that can present challenges to the performance and reproducibility of these downstream assays. From sample acquisition and storage to nucleic acid extraction and quality control, variation may be introduced in ways both obvious and inconspicuous. This article focuses on one often over-looked, yet critical, aspect of quality control: nucleic acid quantitation.
Results from even commonly-used technologies, such as real-time PCR, can be challenging to reproduce, making it difficult to draw conclusions from a particular experiment. Quantitating nucleic acid samples is important for the successful outcome of these assays in several ways:
- Ensure linear amplification: Real-time PCR reactions require a delicate balance of nucleic acid template, primers, probes and other master mix components along with cycling parameters. Accurate nucleic acid quantitation ensures linear amplification of target amplicons while minimizing concatamers, primer dimers and other non-specific artifacts (1).
- Consideration of amplification inhibitors: Nucleic acid extraction efficiency and sample purity depend on numerous variables, such as sample type and method of extraction. In many cases, co-purified contaminants are common and may act as amplification inhibitors. Quantitating your sample is crucial because samples with the highest concentration of template also have the highest level of inhibitors, which may cause a delayed Cq. On the other hand, samples with lower template concentrations have lower levels of inhibitors, so the Cq is minimally delayed.
- Normalize samples for gene expression applications: When comparing gene expression, your gene of interest must be normalized to one or more reference genes. Quantitating the nucleic acid ensures that equal amounts of reference and sample are run in parallel (2).
- Ensure sufficient RNA input: For molecular techniques using cDNA, problems with reproducibility can be attributed to variation in the amount of RNA used in the RT step (3). Similarly, with next-generation sequencing, low mRNA input can result in variability due to inefficient amplification. This inefficient amplification of low to moderately expressed transcripts could mask subtle biological differences (4). Quantitating RNA before amplification is crucial to ensuring that a sufficient amount of RNA is used in the assay.
Methods for Quantitating Nucleic Acid
There are several common laboratory techniques used to estimate nucleic acid sample concentration. A common misconception, however, is that all these methods have similar accuracy or even measure the same thing: how much DNA or RNA is in the sample. In fact, every method measures something different. Depending on what method you choose, contamination or or other issues can lead to an inconsistent estimation of concentration.
Spectrophotometry
The Beer-Lambert Law relates the absorption of light to the properties of the material through which the light travels. This law states that there is a logarithmic dependence between the transmission of light through a substance and the product of the absorption coefficient of the substance and the path length (Figure 1). For DNA and RNA, the heterocyclic rings of nucleotides (adenine, guanine, cytosine and thymine/uracil) result in nucleic acid molecules absorbing ultraviolet (UV) light maximally at 260nm (λmax = 260nm).

A = absorbance at a particular wavelength
ε = extinction coefficient
b = path length of the spectrophotometer
c = concentration of sample
Figure 1. Beer-Lambert Law for calculating concentration of an analyte by UV absorbance.
The Beer-Lambert law can be used with the appropriate extinction coefficients to determine nucleic acid concentration.
Concentration (ng/ul) = [Absorbance (AU) x Extinction coefficient] / Path length (cm)
Extinction coefficients:
dsDNA: 50ng-cm/µl
ssDNA: 33ng-cm/µl
RNA: 40ng-cm/µl
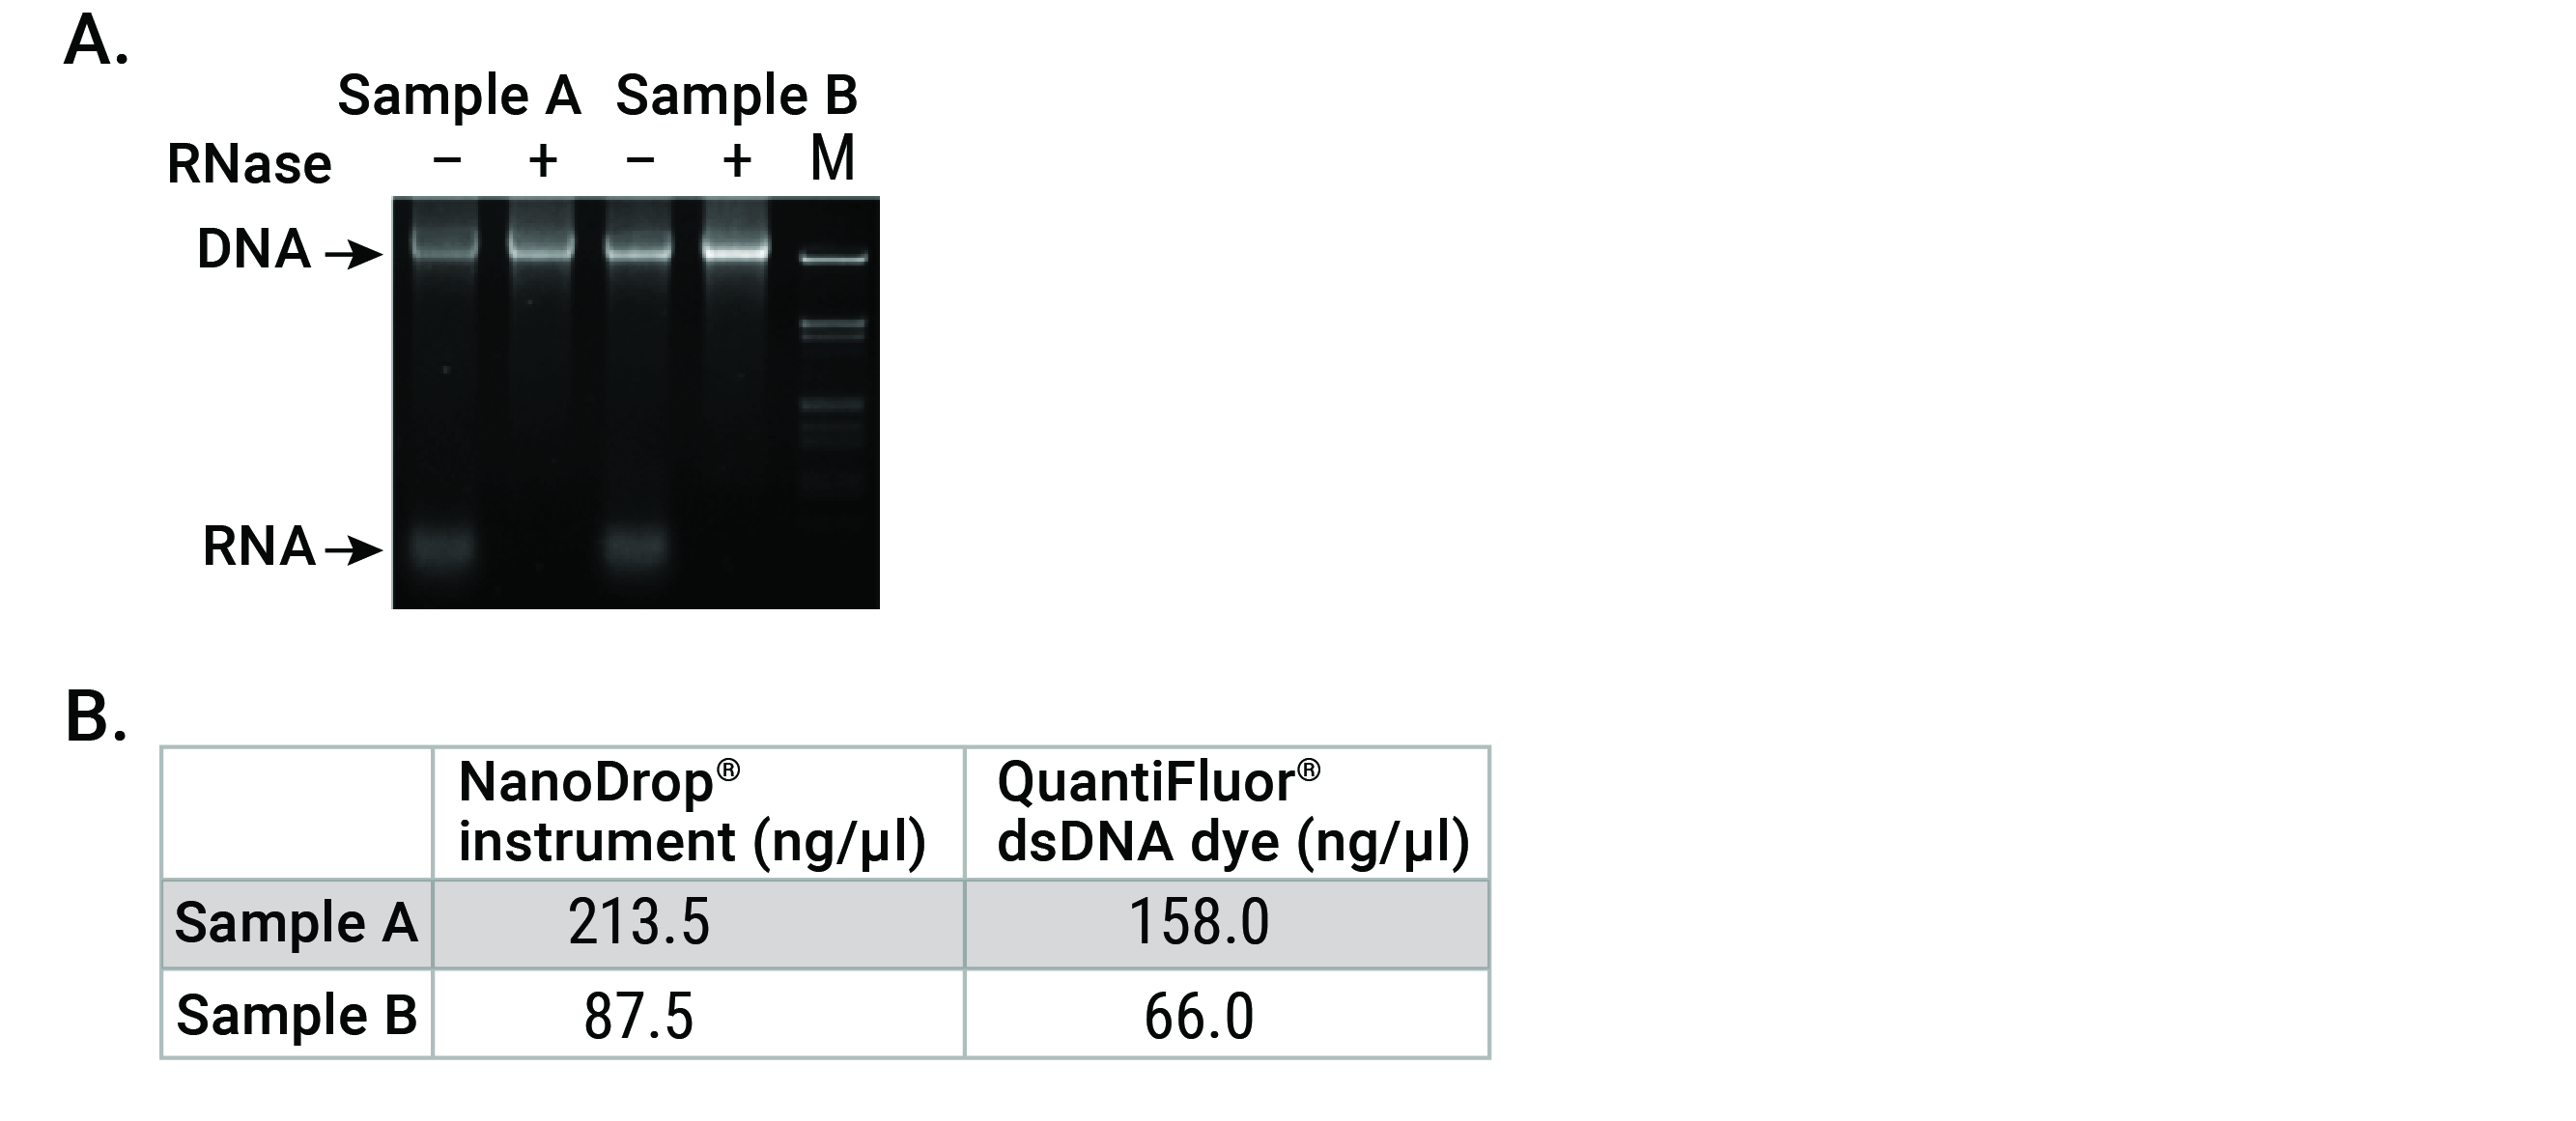
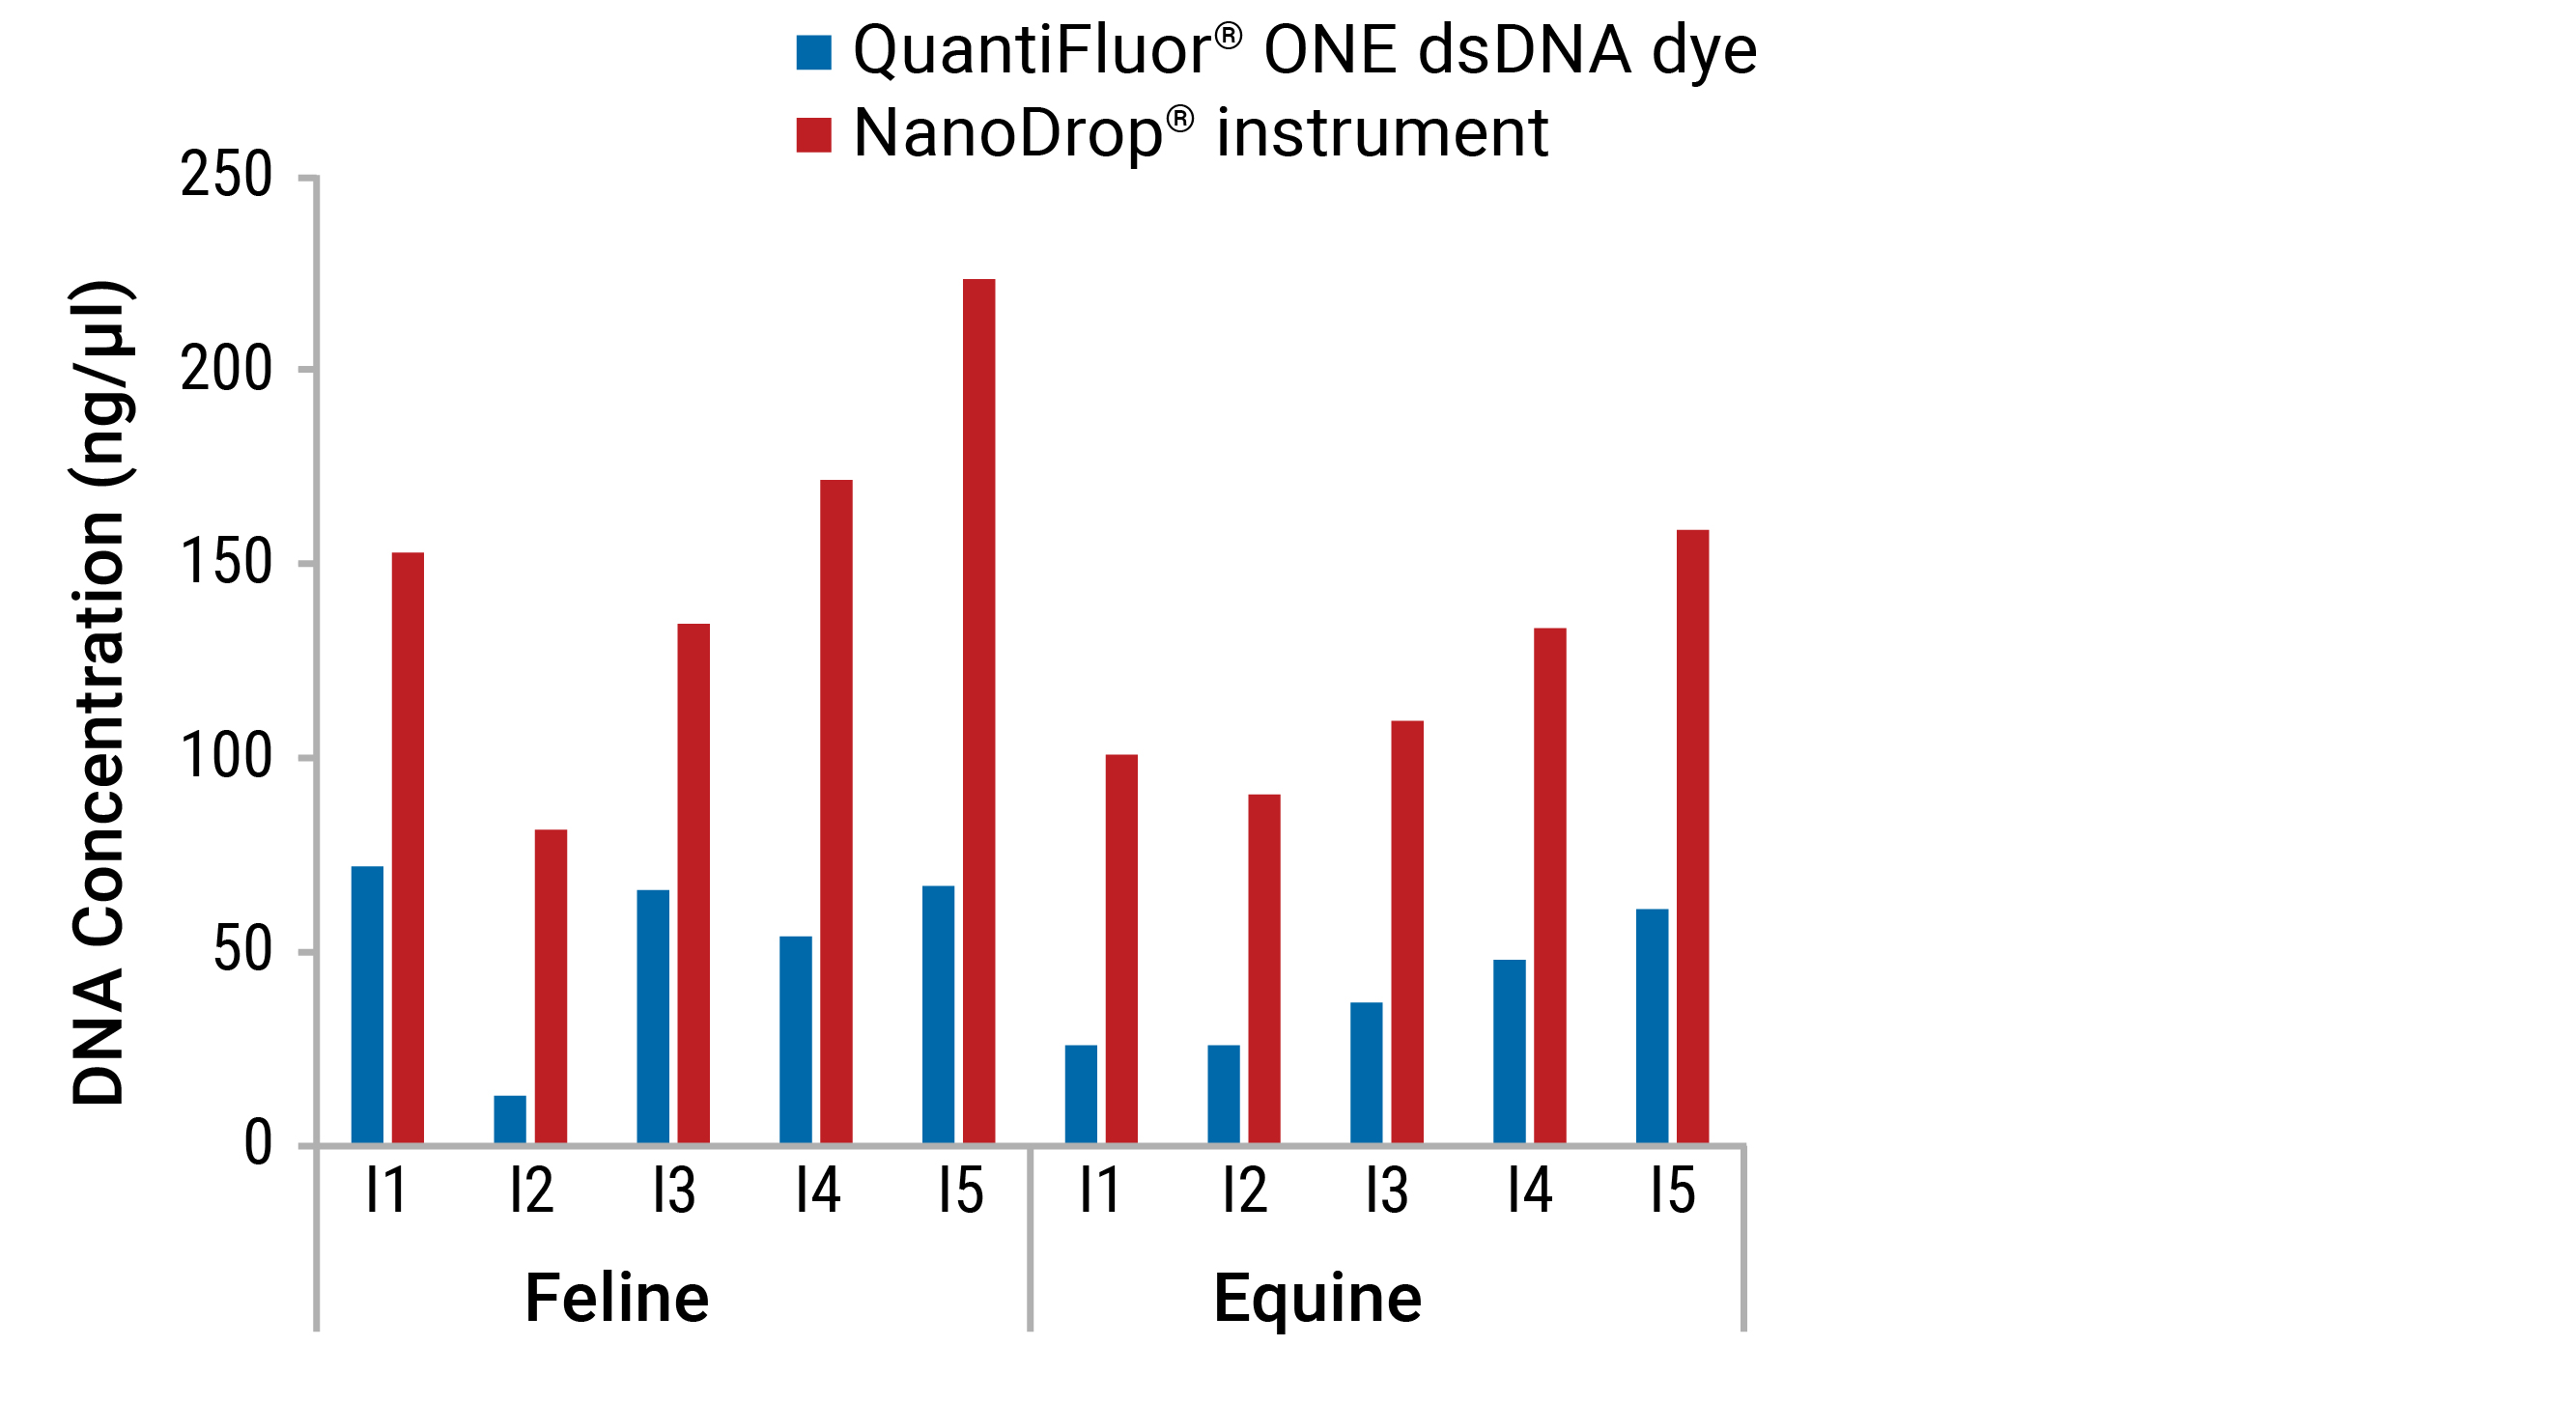
For most commercial instruments, reliable spectrophotometric quantification (A260) readings lie between 0.1 and 1.5. On a spectrophotometer with a 1cm path length, the theoretical dynamic range for DNA would equate to 5–75ng/µl. The NanoDrop®-2000 instrument claims a path length as low as 0.05mm (0.005cm) enabling a theoretical dynamic range of 2–15,000 ng/µl. While this range allows detection of high dsDNA concentrations, the low end range of 2ng/µl (5) is not very sensitive when you consider the low concentration of nucleic acids found in many common sample types (e.g. plasma, cerebrospinal fluid, urine, fine needle aspirates, laser capture microdissection, single cells and FFPE tissue, etc.) Accuracy is also a major concern for UV spectrophotometry. While nucleic acids absorb maximally at 260nm, other common contaminants absorb strongly at wavelengths near 260nm. Solvents such as guanidine and phenol, as well as salts, have maximal absorbance around 230nm, while proteins contribute at 230nm and 280nm. These neighboring peaks, if present in a sample, will inflate the reading at 260nm. Furthermore, dsDNA, ssDNA, RNA, free nucleotides and primers cannot be discriminated from each other in a sample (5; Figure 2).
Fluorescence
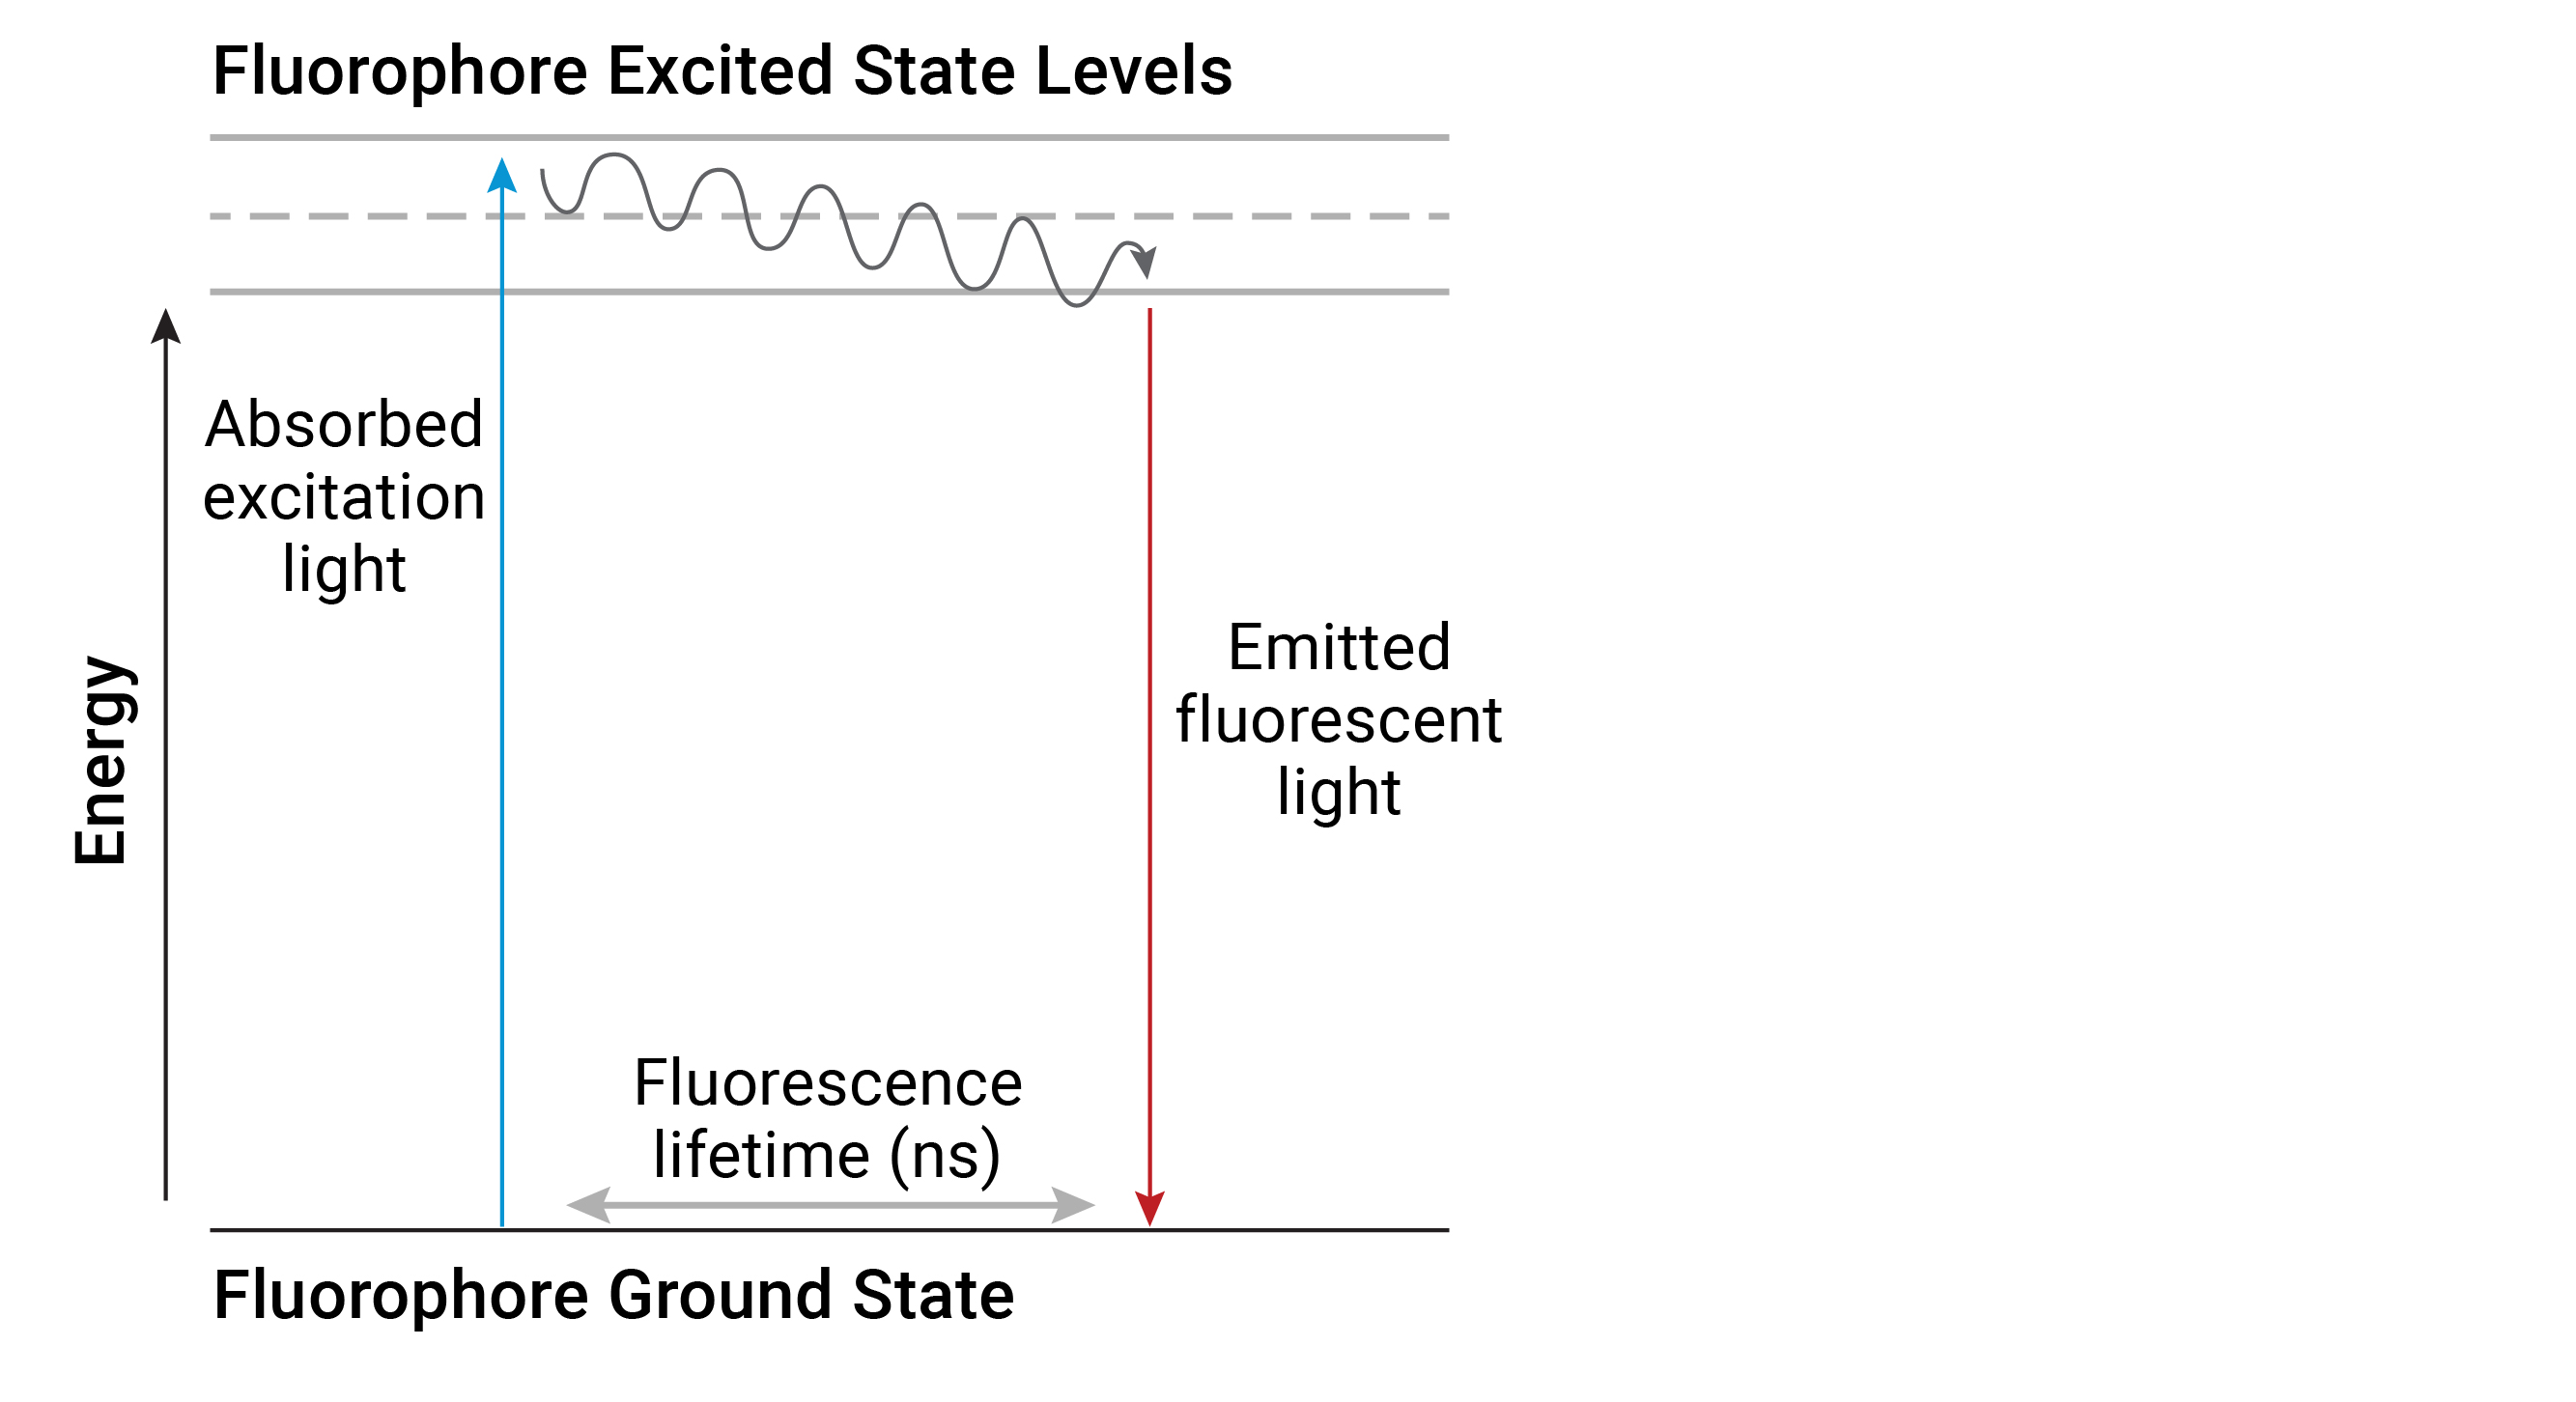
Fluorometry, otherwise known as spectrofluorometry (herein referred to simply as fluorescence) is another type of electromagnetic spectroscopy which analyzes the light emitted from fluorogenic molecules called fluorophores. Fluorophores respond distinctly to light compared to other molecules. When a photon of excitation light is absorbed by an electron of a fluorophore, the energy level of the electron rises to an excited state. During the short excitation period, some of the energy is dissipated and the remaining energy is emitted as a photon to relax the electron back to the ground state. Because the emitted photon usually carries less energy and therefore has a longer wavelength than the excitation photon, the emitted fluorescence can be distinguished from the excitation light with a fluorometer (Figure 3).
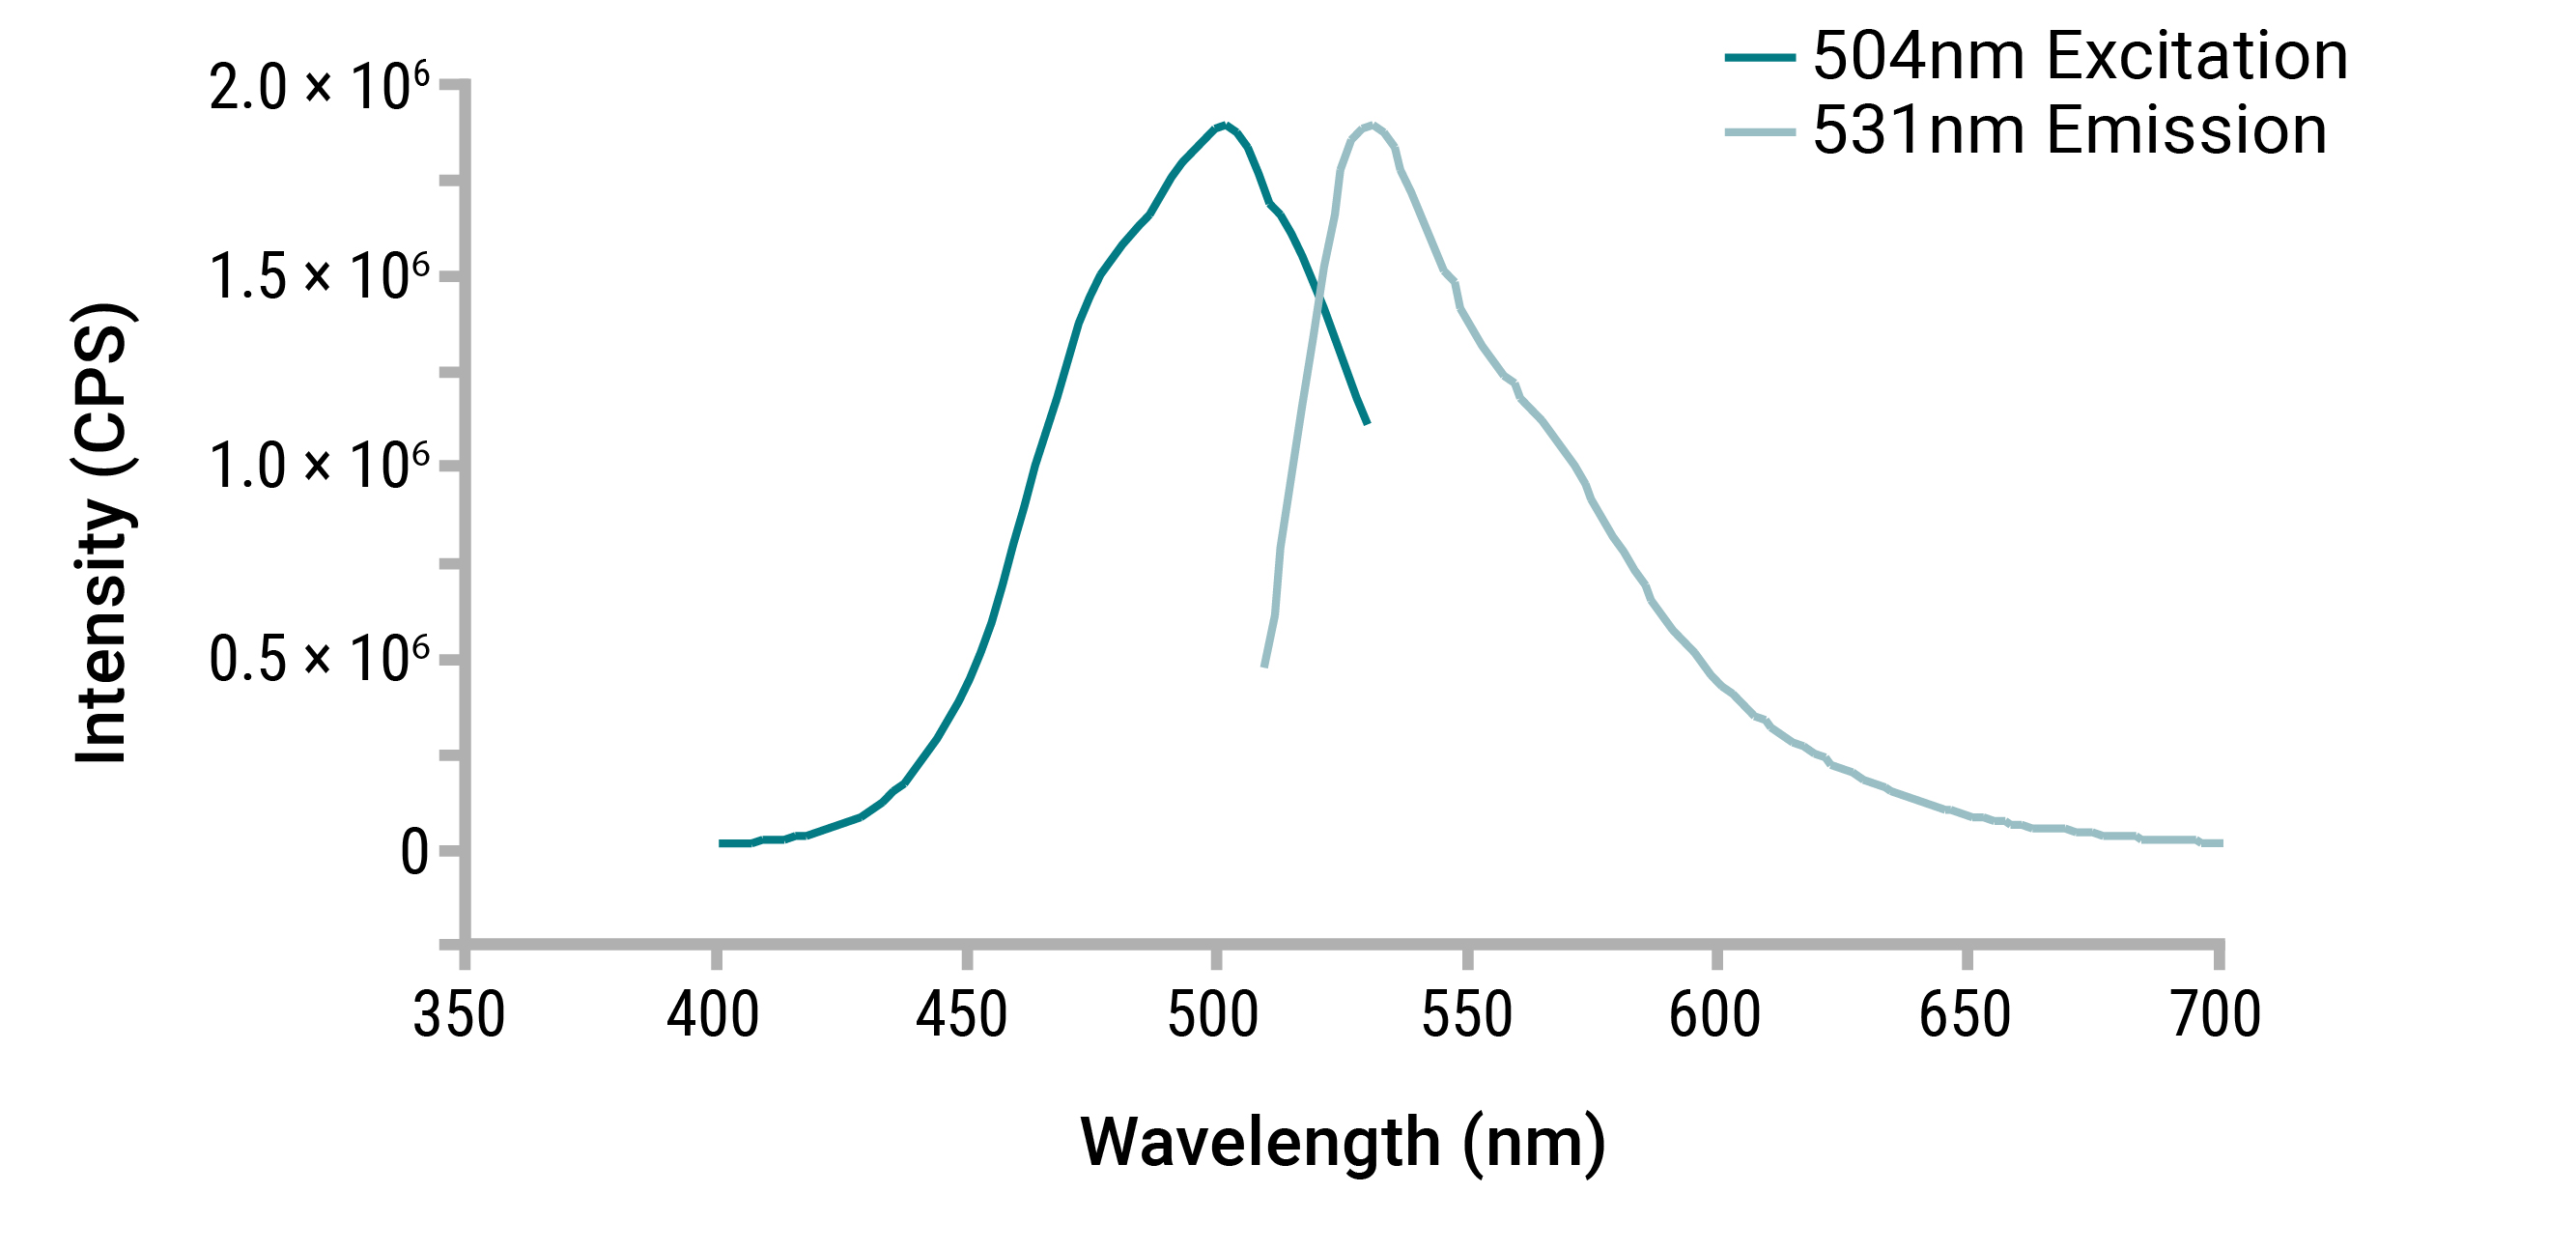
Fluorescence dye-based quantitation methods take advantage of this mechanism by employing dye molecules that have been designed to preferentially bind a given species of nucleic acid. When a dsDNA dye, for example, is excited by a given wavelength of light, only dye in the dsDNA-bound state will fluoresce. As the dye binds to the target nucleic acid, fluorescent quantum yield increases as a function of shift in fluorophore molecular geometry. This aspect of the fluorescence quantitation technique, in conjunction with preferential dye:target binding, results in a low background signal, high accuracy and specificity, making it ideal for quantitation of low-level nucleic acid samples (Figure 4).
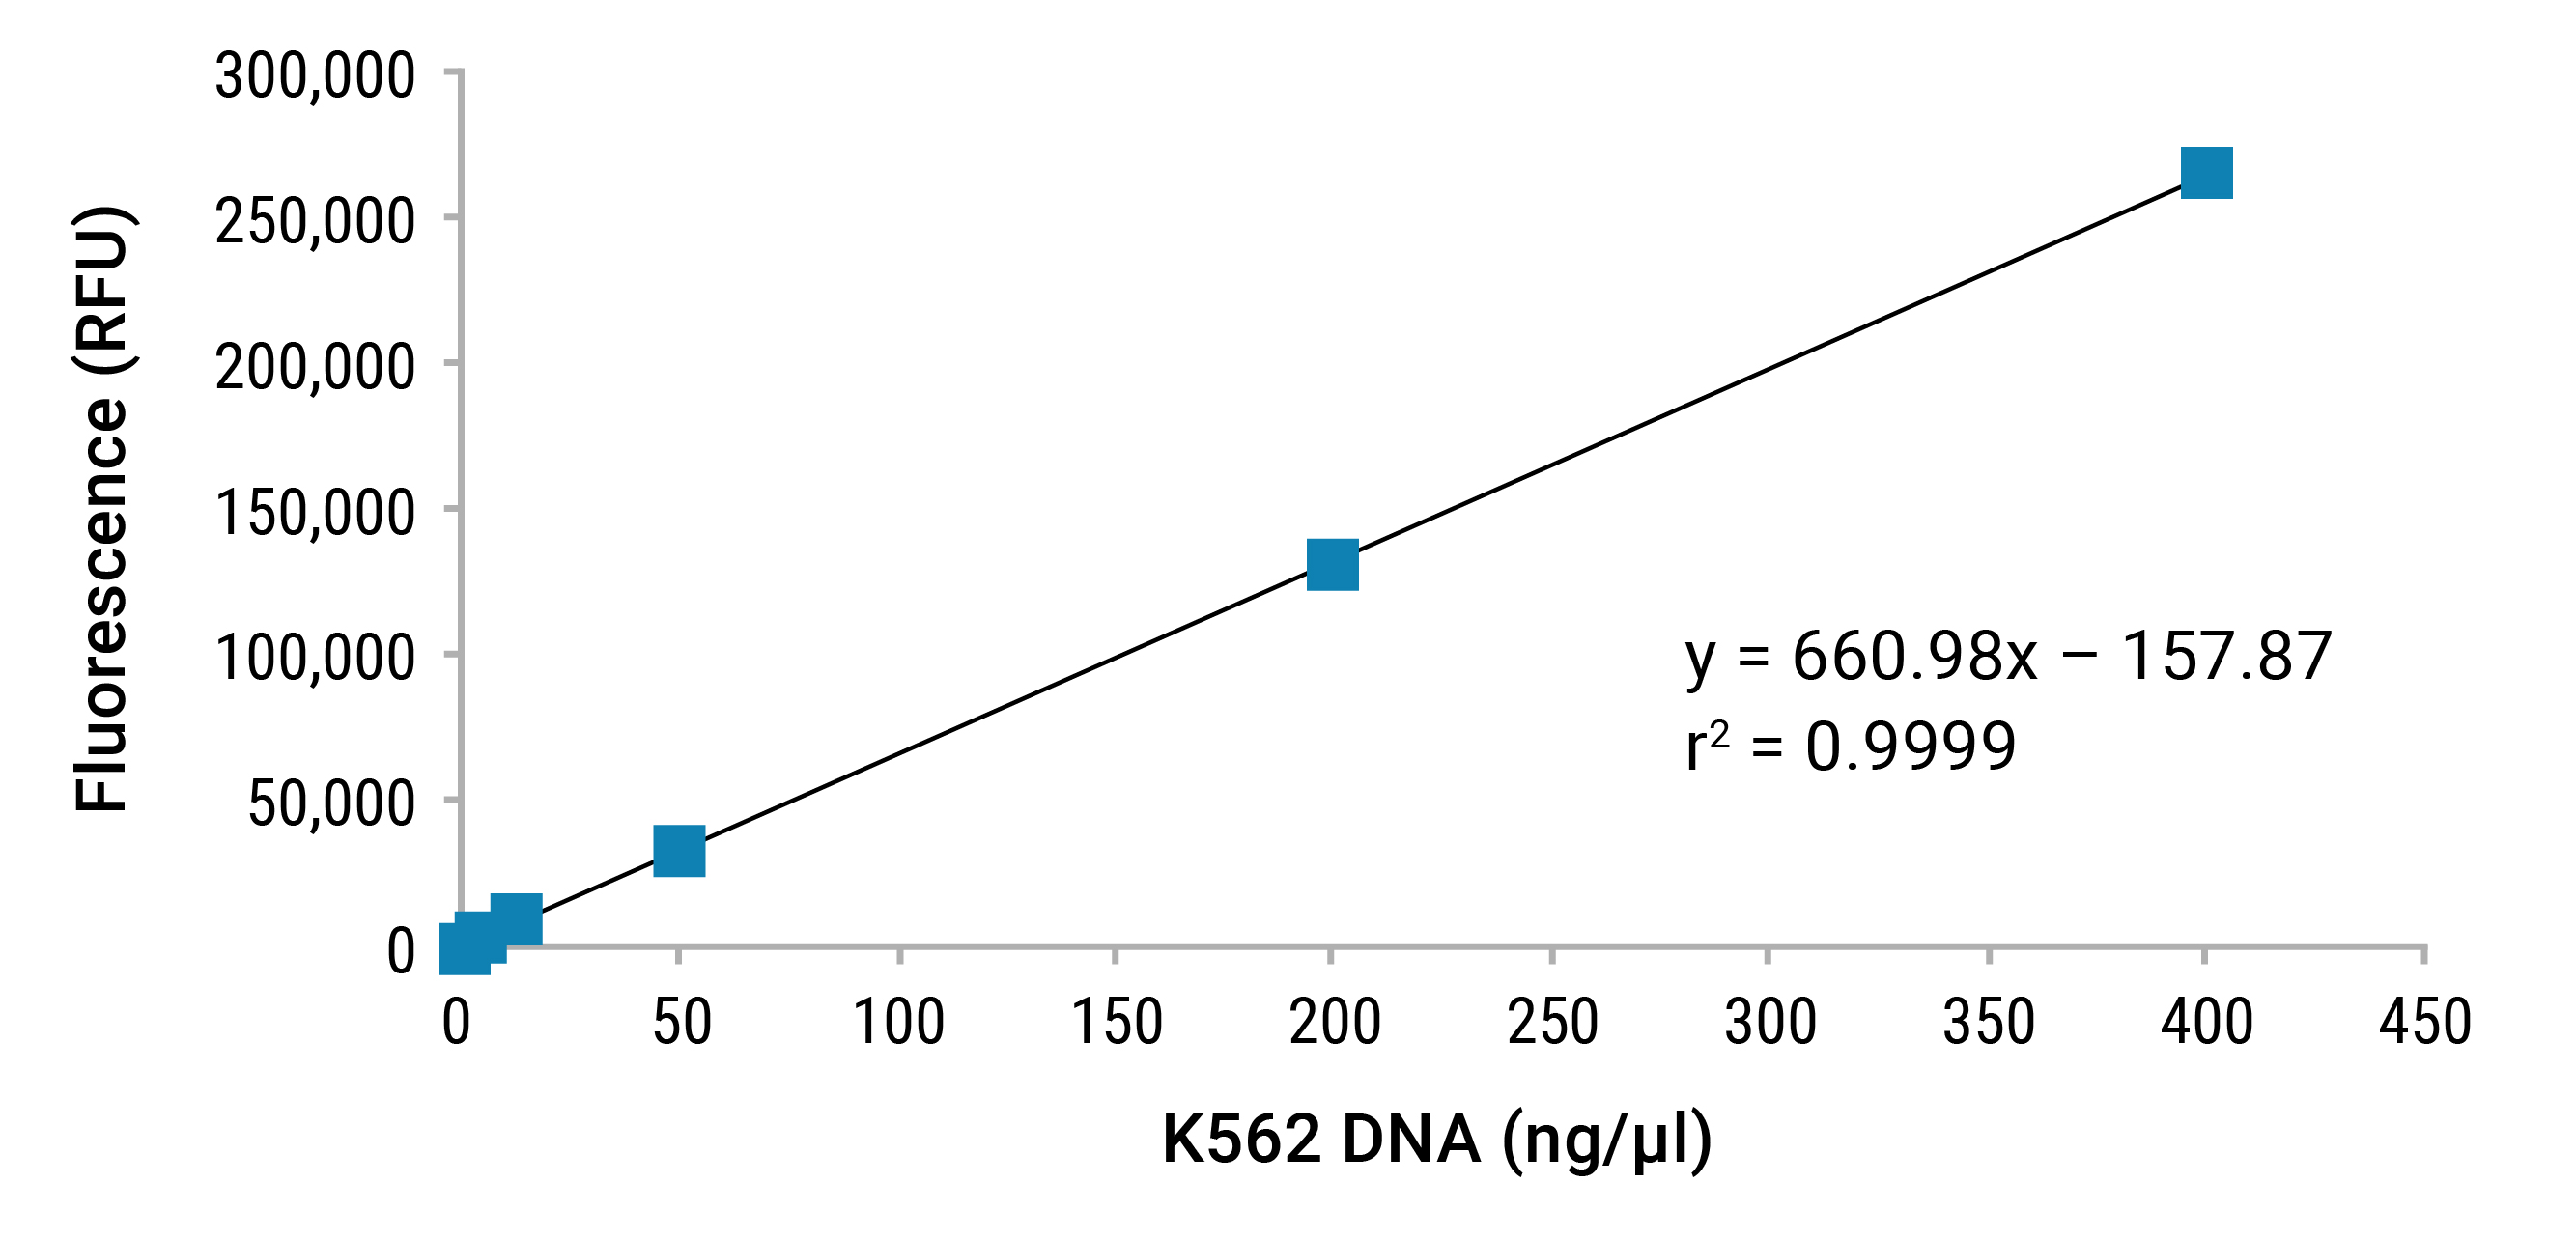
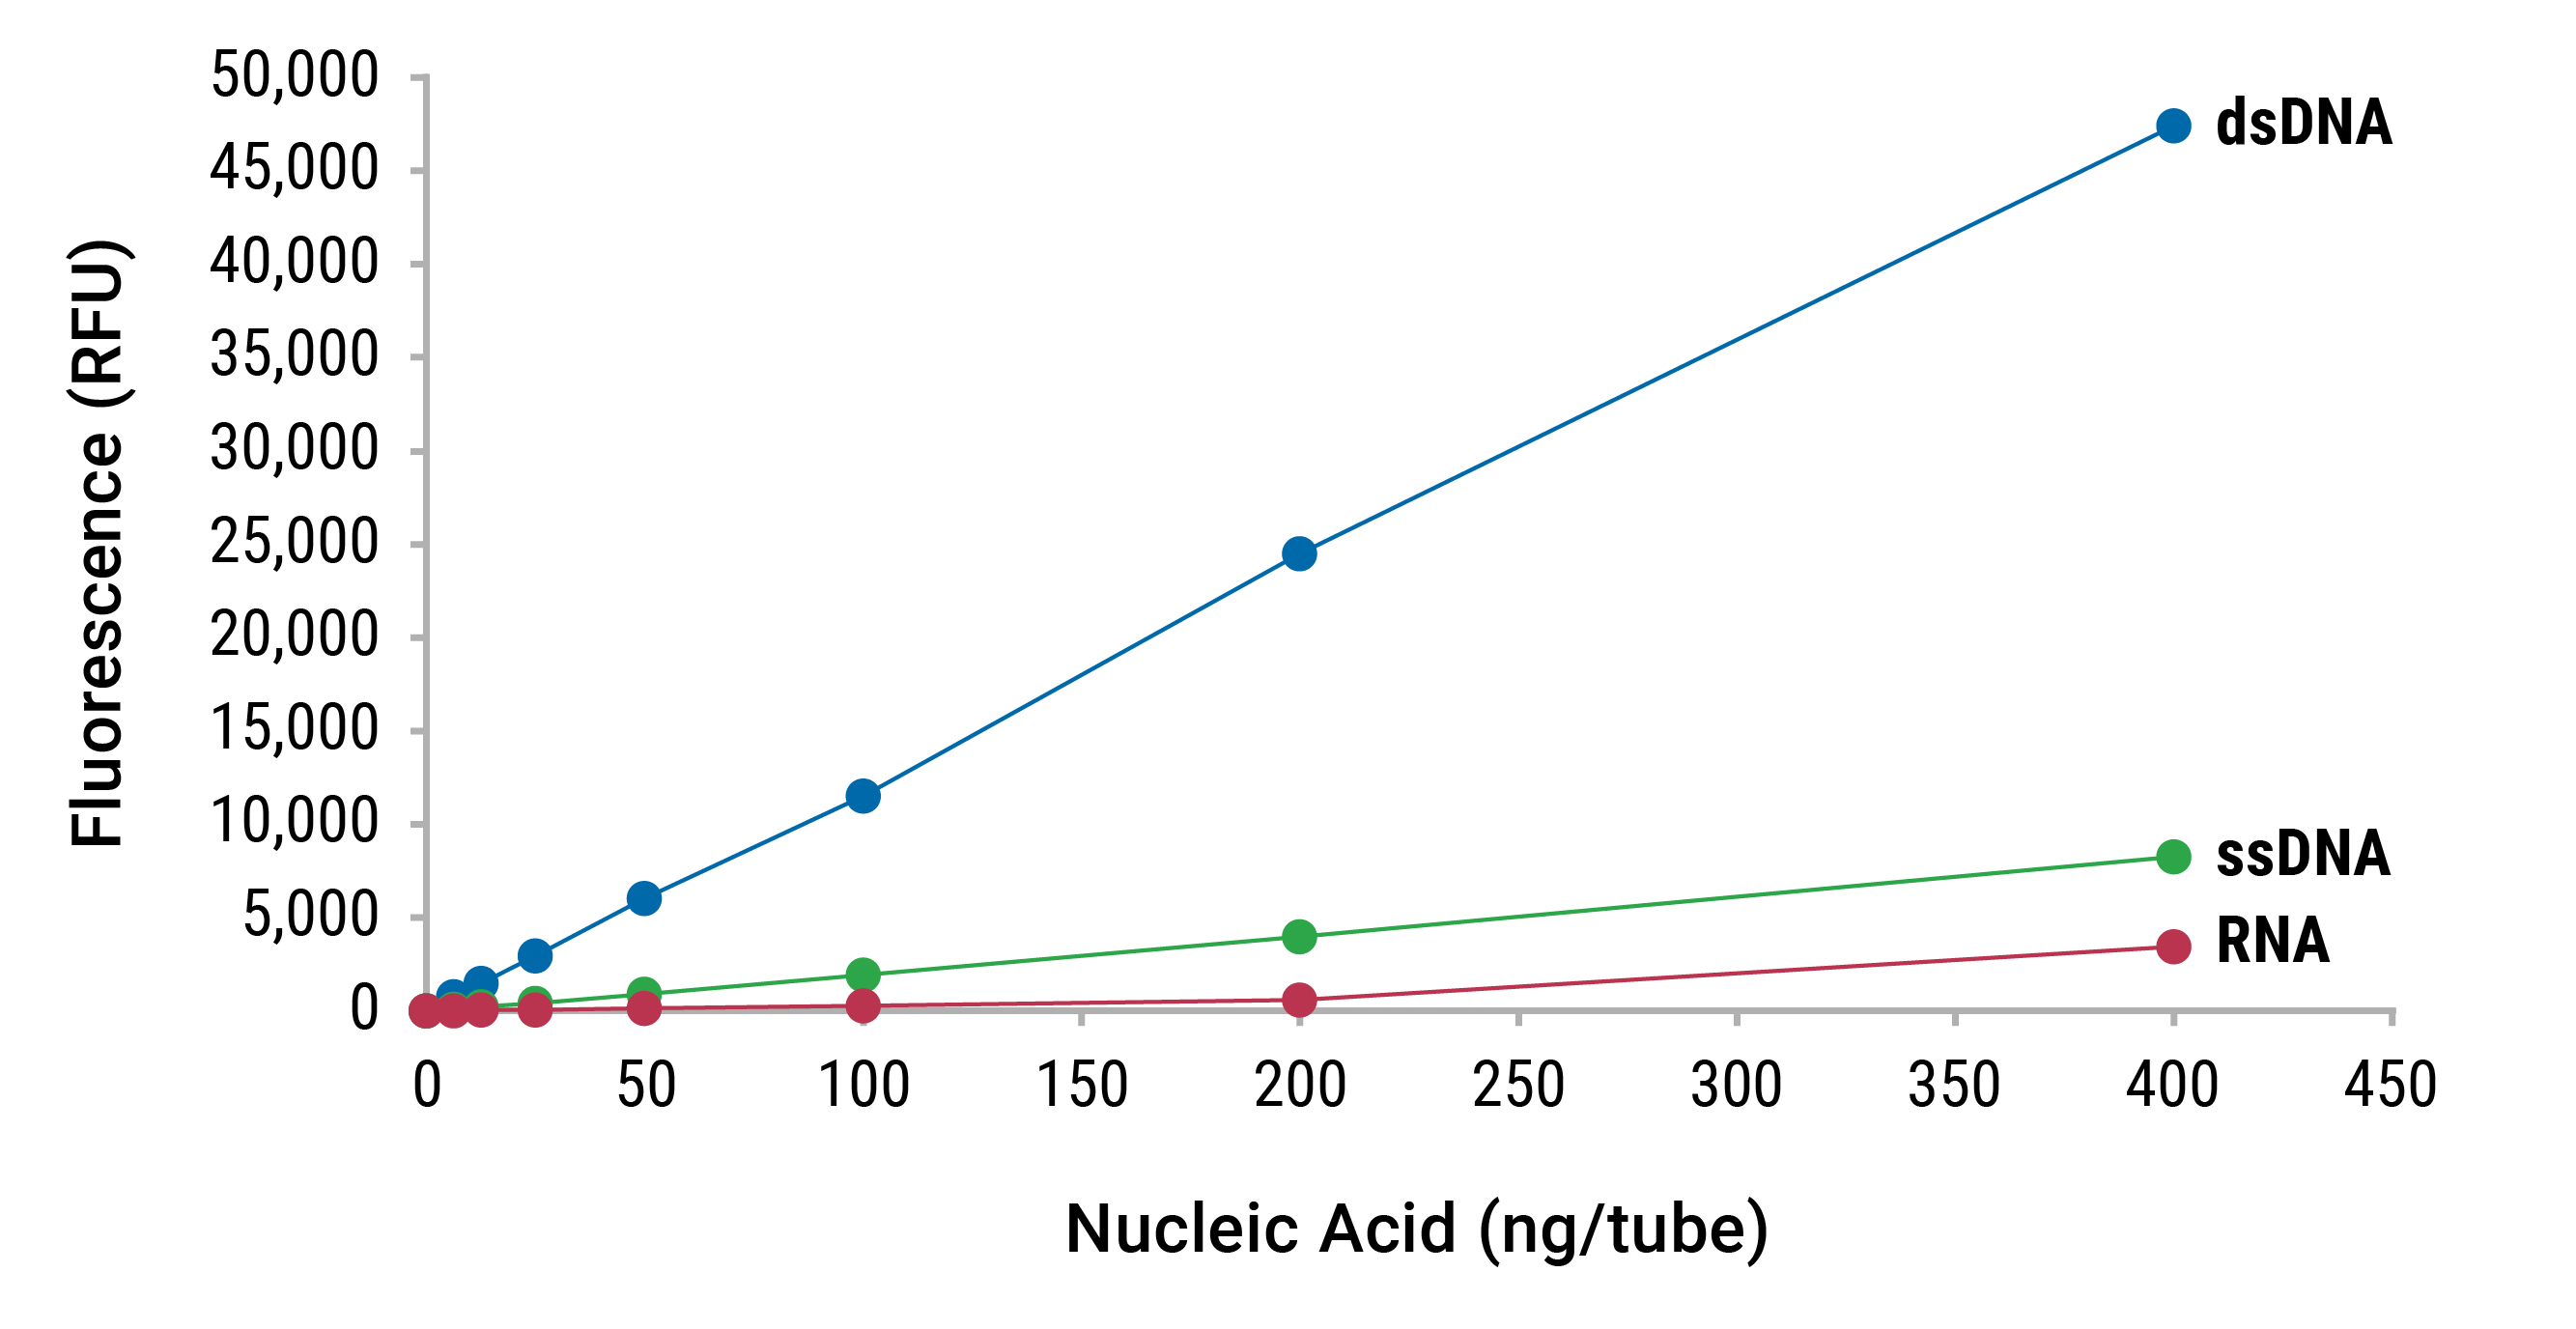
For this type of assay to be quantitative, a dilution series of sample of known concentration is used to create a standard curve. A fluorometer is used to read and record the relative fluorescence units (RFUs) for each point of the curve. These data will form a regression curve that can be used with either linear (y=mx+b) or power (y=axb) fit analyses to interpolate the concentration of any unknown sample.
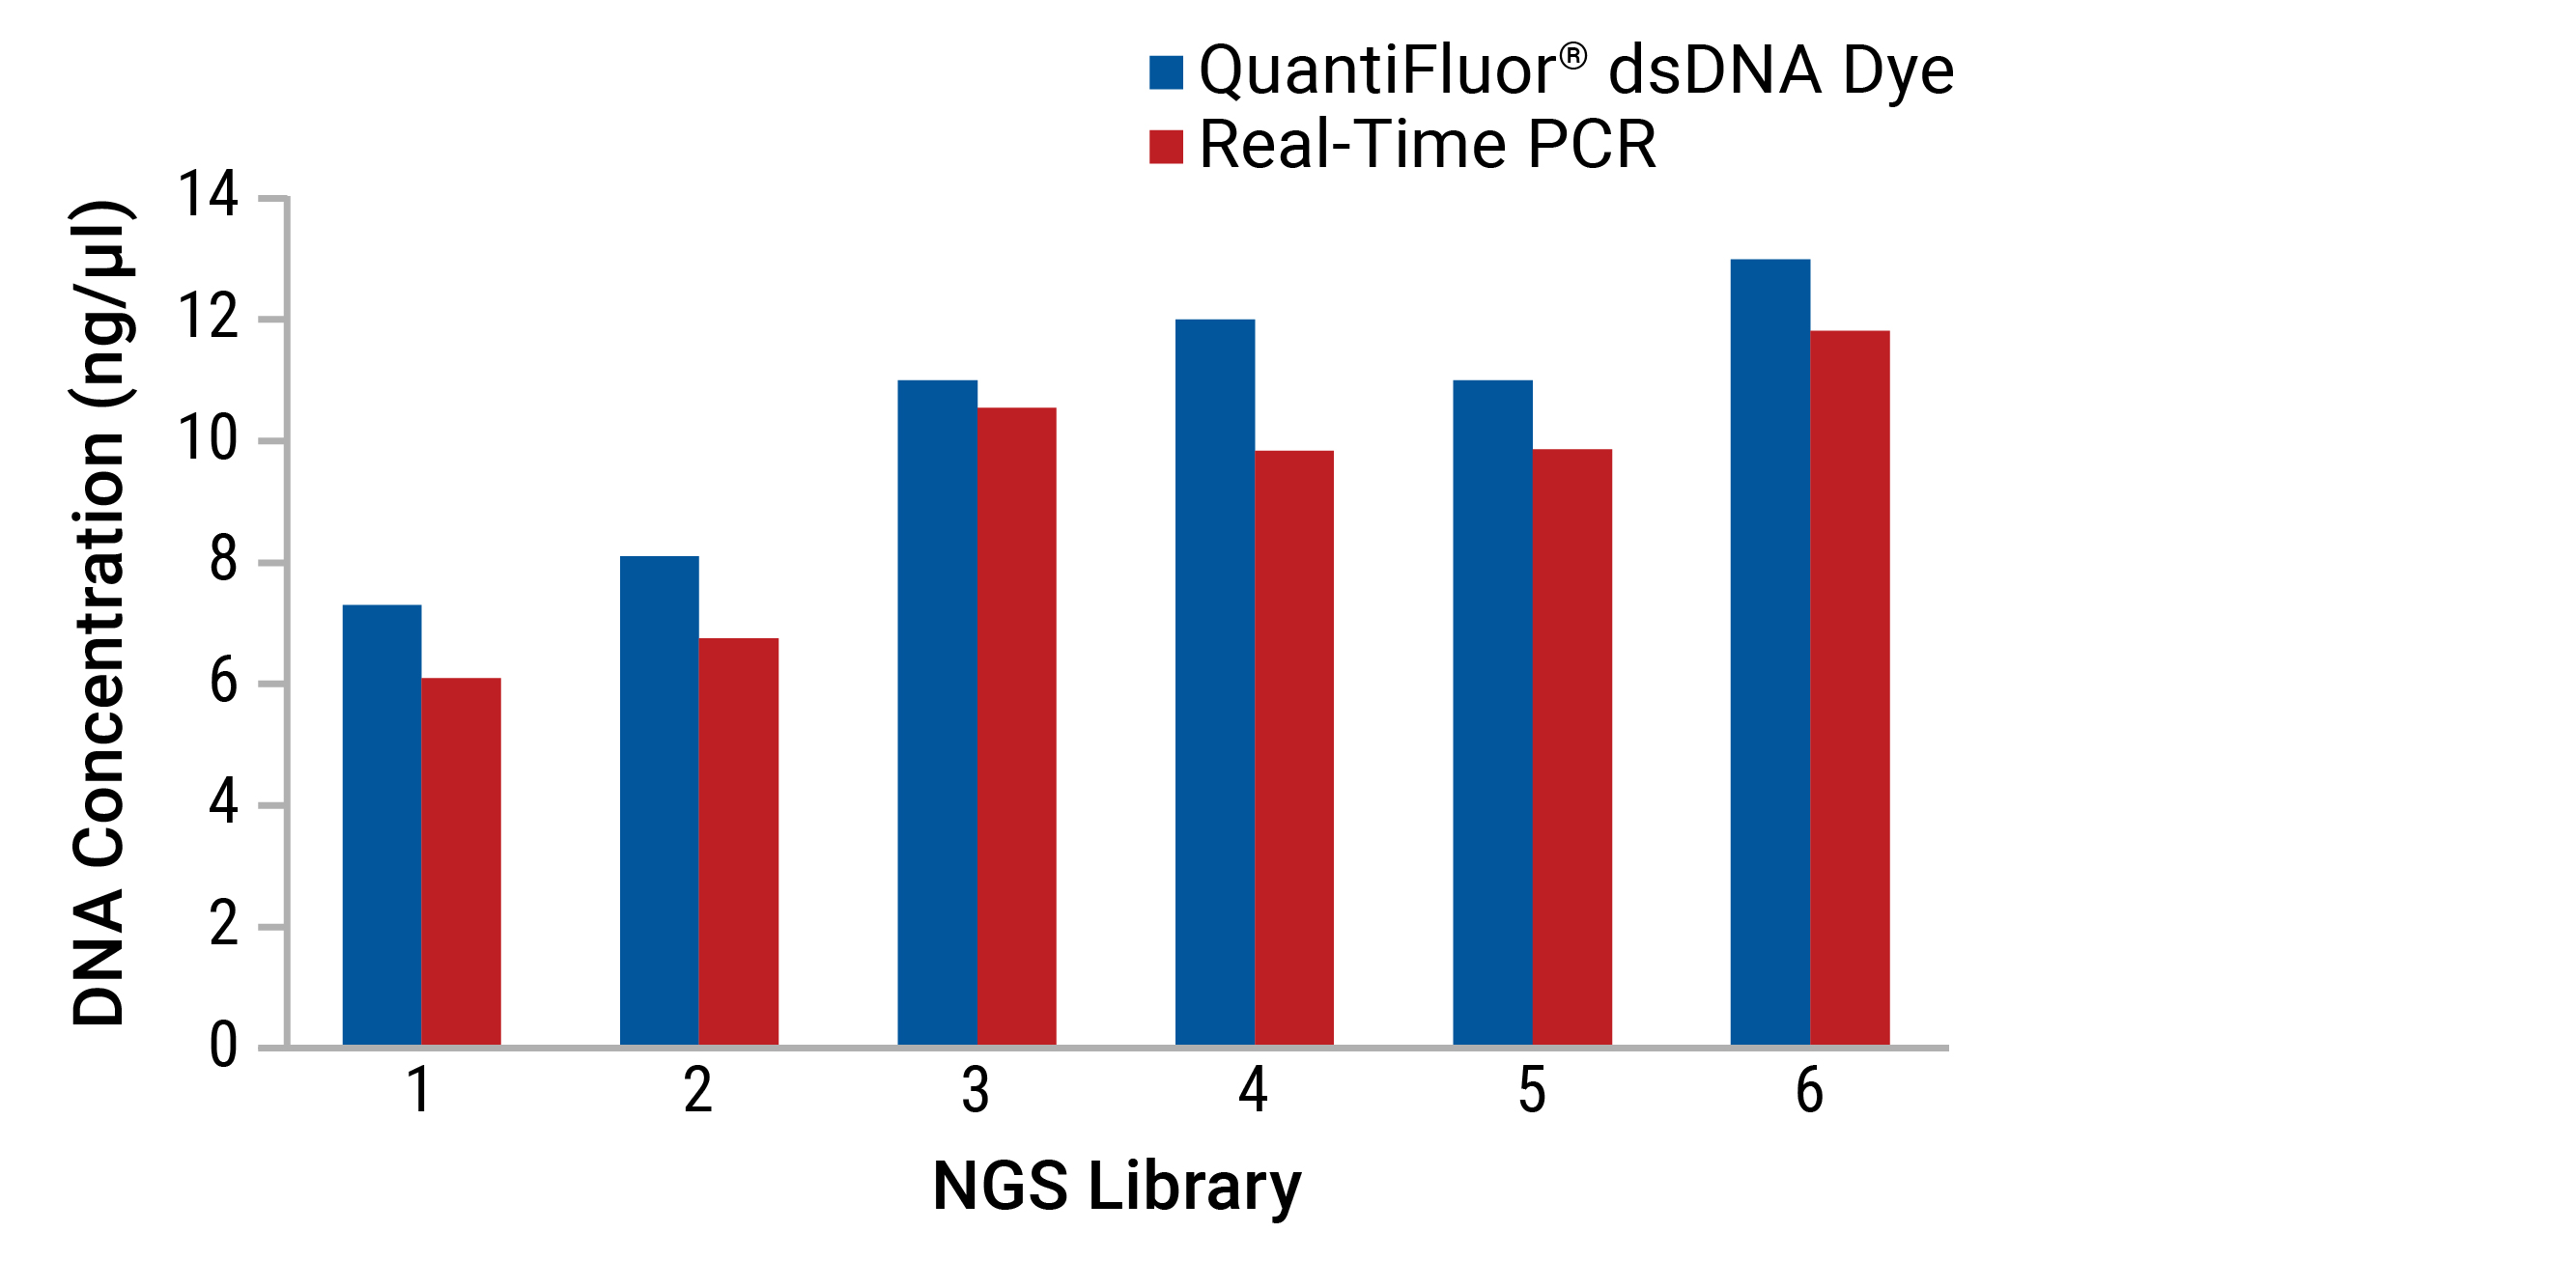
Compared to UV spectrophotometric methods, fluorescence demonstrates improved specificity because it is less affected by other components present in samples. As a result, fluorescent methods lead to a more accurate determination of nucleic acid concentration (Figure 5).
Real-Time PCR (qPCR)
Real-time PCR (also known as qPCR) is a technique that relies on thermal cycling consisting of repeated cycles of heating and cooling for DNA melting and enzymatic replication of targeted amplicons by DNA polymerase. After n rounds of thermal cycling, a total of 2n PCR products are formed. Detection instruments measure the accumulation of DNA product after each round of PCR amplification using fluorescent reporters. The reporters can be either dyes like SYBR® green or probes such as TaqMan®. RNA can be measured with the same process following a preliminary reverse transcription (RT) step converting it to cDNA.
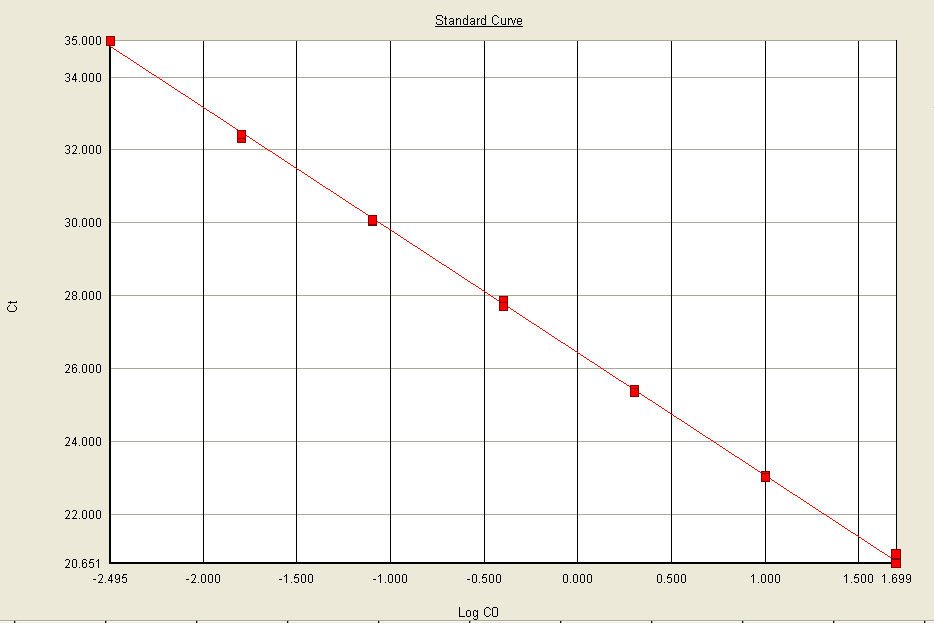
The primary data from a real-time PCR experiment is an amplification curve, which shows the fluorescent signal in relative fluorescent units (RFUs) versus the cycle number and charts the accumulation of amplified product. The baseline is measured early in the amplification process before the instrument can detect product formation. As product accumulates, it reaches a point where the instrument is able to detect the change in signal above the background level--this is the exponential portion of the curve.
The detection threshold is the level of fluorescence where the product accumulation can be distinguished from the background. This threshold is automatically set above the baseline, within the exponential region of the amplification curve. The cycle number where the amplification product crosses that detection threshold is the Quantification Cycle (Cq) (Figure 6).

An unknown sample concentration can be estimated from its corresponding Cq number when compared to a standard curve of Cq values from samples of known concentration (Figure 7).
The real-time PCR strategy of quantitation offers several advantages over other methods:
- Real-time PCR offers the most sensitive detection, as low as picogram quantities of nucleic acid.
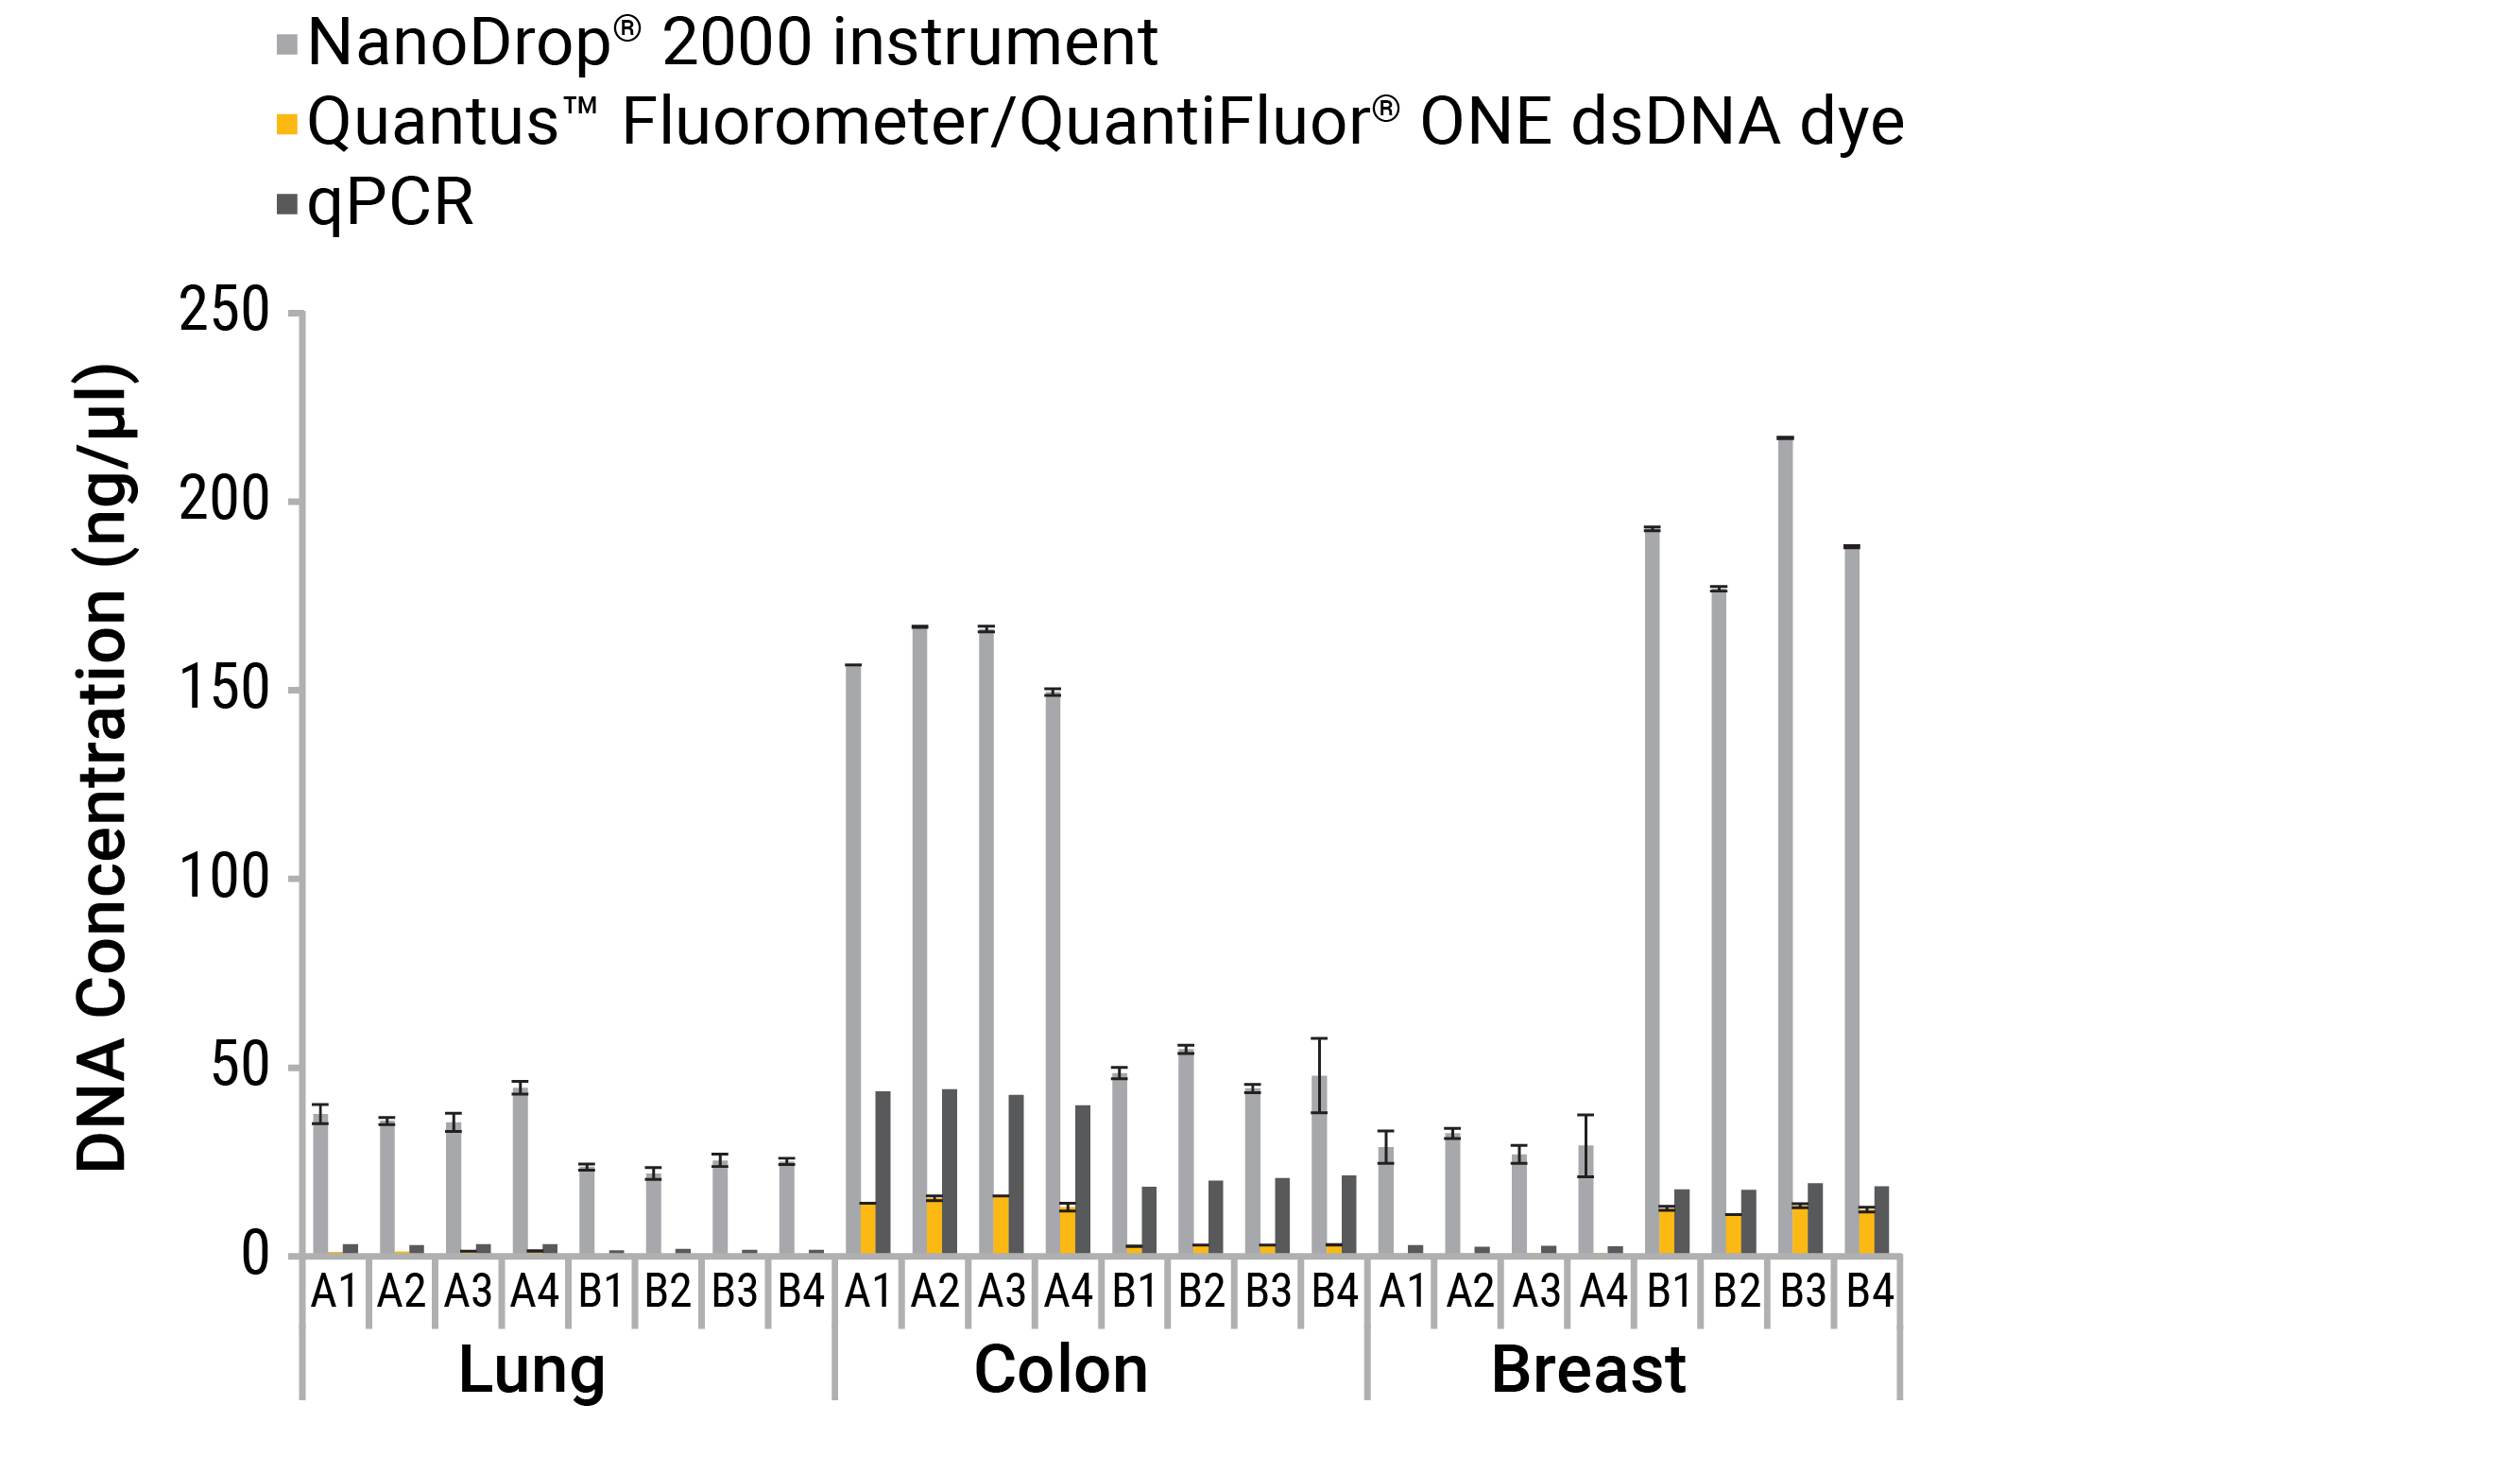
- Real-time PCR can accurately quantitate a subset of specific nucleic acids of interest, even in the presence of common contaminants, other nucleic acids, primers and free nucleotides. This is because PCR primers can be designed for sequence-specific targets (such as certain domains, species or genes) (Figures 8 and 9).
Because real-time PCR exploits the enzymatic replication of DNA polymerase, it only measures those molecules that are amplifiable. The implication is that highly degraded samples and fragments that won’t amplify in a downstream assay also won’t contribute to a concentration estimate.
Summary
While quantitation is but one small step in the multifaceted nucleic acid sample preparation workflow, it can have large implications on performance and validity of conclusions drawn from downstream assays. Best practice guidelines such as MIQE (1), MIAME (5) and MIGS (6), among others, recognize the importance of quality control steps such as quantitation. These guidelines call into consideration that the right technique be used and reported in publications. This ensures that experiments are reproducible and the conclusions are sound. Currently, fluorescent dye-based methods are most commonly recommended for determining sample concentration prior to normalization exercises and loading into advanced downstream analyses. This technique represents a happy medium between the rigors demanded of quantitation methods and the practicality of incorporating it into a workflow. Each of the methods discussed here have their merits and appropriate uses (Table 1). It is ultimately up to each researcher to evaluate what is being measured for a given quantitation technique and choose the method most appropriate for the task at hand.
Table 1. The pros and cons of common quantitation methods.
| Quantitation Method | Pros | Cons |
|---|---|---|
| UV Spectrophotometry |
|
|
| Fluorescence |
|
|
| Real-Time PCR |
|
|
References
- Bustin S.A. et al. (2009) The MIQE guidelines: minimum information for publication of quantitative real-time PCR experiments. Clin Chem. 55, 611–22.
- Huggett J. et al. (2005) Real-time RT-PCR normalization; strategies and considerations. Genes and Immunity. 6, 279-284.
- Bustin S.A. et al. (2015) Variability of the Reverse Transcription Step: Practical Implications. Clin. Chem. 61, 1.
- Bhargava V. et al. (2014) Technical variations in low-input RNA-seq methodologies. Sci. Rep. 4, 3678.
- https://assets.thermofisher.com/TFS-Assets/CAD/manuals/ts-nanodrop-nucleicacid-olv-r2.pdf
- Brazma A. et al. (2001) Minimum information about a microarray experiment (MIAME)—toward standards for microarray data. Nat. Genet. 29, 365–371
- Field D. et al. (2008) The minimum information about a genome sequence (MIGS) specification. Nat. Biotechnol. 26, 541–7.