What to Expect (from the NanoBRET® Assay) When You're Expecting (a Protein:Protein Interaction)
Doug Wieczorek, Amy Landreman and Julia Nepper
tpub_219, Oct. 2019
Abstract
So, you have reason to believe that two proteins you are studying might interact. There are many methods to test whether a protein:protein interaction (PPI) is occurring, including yeast two-hybrid assays, coimmunoprecipitation and affinity purification. Each method has its own strengths and weaknesses in terms of detection sensitivity and interaction specificity.
Is the NanoBRET® Protein:Protein Interaction System Right for Me?
Resonance energy transfer methods have emerged as popular techniques to demonstrate PPI in live cells and are often used to confirm interactions that are identified using other in vitro methods. With fluorescence/Förster resonance energy transfer (FRET), the energy created by the excitation of one fluorescent protein (donor) is transferred to a second fluorescent protein (acceptor) only in close proximity. The interaction is confirmed by detection of signal at the acceptor emission wavelength. Bioluminescence resonance energy transfer (BRET) assays have incorporated bioluminescent molecules as the donor, reducing background, improving sensitivity and eliminating the need to have an excitation wavelength for the donor. NanoBRET® technology has further improved upon these techniques by incorporating NanoLuc® luciferase as the donor, as well as a HaloTag® fusion protein that can bind fluorescent ligands. Together, these technologies allow for increased donor signal and separation between the luciferase and fluorescent emission, leading to even greater assay sensitivity and dynamic range.
Here we describe how we developed a NanoBRET® assay for a PPI that has been previously characterized using only in vitro methods. We chose Nanos and Pumilio (Pum), two RNA-binding proteins that are found in many organisms, including humans (1). Genetic studies in Drosophila have shown that these two proteins influence development, the nervous system and the behavior of stem cells by switching off the production of certain proteins. Pum binds with high affinity to specific sequences in target mRNAs to repress protein expression and enhance mRNA degradation. Nanos acts like a clamp to hold Pum close to specific RNAs, which allows Pum to switch off the production of the corresponding proteins. The presence of Nanos allows Pum to regulate RNAs that it cannot bind to alone. Regulation of mRNA by Pum and Nanos is dependent on Nanos Response Elements (NREs) in the 3´ UTR. Each NRE contains a binding site for Pum with an RNA consensus sequence, the Pumilio Response Element (PRE).
We share some lessons learned and important tips to help you create a successful NanoBRET® PPI experiment.
NanoBRET requires a multimode plate reader, such as the GloMax® Discover, that is capable of sequentially measuring filtered luminescence (to capture the donor signal) as well as filtered fluorescence (to capture the acceptor signal). Consult your instrument manufacturer to ensure the proper filters are available.
How Do I Know Which Protein Constructs Will Work for NanoBRET?
The short answer is, you don’t—at least not initially. NanoBRET requires that one of your proteins gets tagged with NanoLuc® luciferase while the other protein is tagged with HaloTag® protein. But which protein should receive which tag? And should the tag be placed on the N-terminus or the C-terminus of each protein? If structural information is known, it may seem logical to place a tag at a specific terminus. But these are questions that must be answered empirically. Adding a tag to a protein can affect its ability to fold properly as well as its expression level. It’s also possible that the tag itself could alter or prevent the very interaction you are trying to detect. Therefore, it is recommended to construct a series of eight NanoBRET® expression vectors incorporating all possible combinations of protein, tag, and terminus.
Full-length Nanos is composed of three distinct regions: N-terminal (N), Zinc Finger (Z) and C-terminal (C). The ZC regions have been shown to be crucial for repression, while the N region only makes a minor contribution. Due to the difficulty in expressing full-length Nanos and Pum, electrophoretic mobility shift assays demonstrating complex formation between Pum and Nanos has been performed with only Nanos ZC and the RNA-binding domain of Pum. So, we chose to use those protein domains in developing our assay.
In our example, we created eight clones of the Drosophila Pum RNA Binding Domain (Pum-RBD) and the Nanos zinc-finger and C-terminal domains (Nanos-ZC) by appending NanoLuc® luciferase (NL or NLuc) donor and HaloTag® (HT) acceptor tags to Pum-RBD and Nanos-ZC using the NanoLuc® NanoBRET® PPI Flexi® Starter System. Pum-RBD and Nanos-ZC were first cloned into the pFN21A (N-terminal HaloTag®) vector and then additional clones with the proper tags at each orientation were transferred from the pFN21A vectors using Flexi® cloning. Before proceeding to the assay, each clone was sequenced to ensure that the correct DNA sequence was present in-frame with no mutations introduced. Clones were also created for full-length Nanos. Results with the Nanos-ZC were found to be similar to full-length Nanos, so we show only data with Nanos-ZC here.
How Do I Determine the Best PPI Combination?
It’s easy—simply pair up the eight possible tagged combinations of your proteins of interest and use NanoBRET to determine which of the eight pairs resulted in the best energy transfer. In our example, the eight combinations of Pum-RBD and Nanos-ZC are shown below.
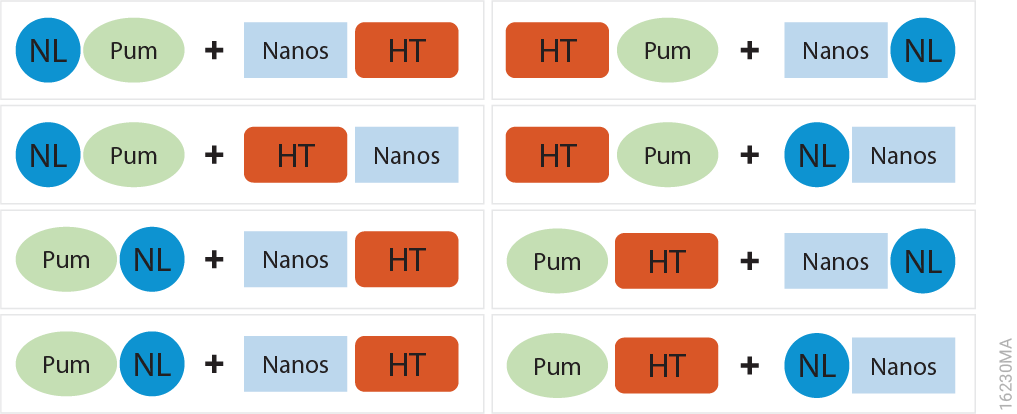
- A transfection mixture for each vector combination consisting of 1µg of the HaloTag® vector and 0.1µg of the NanoLuc® vector (NanoLuc:HaloTag ratio at 1:10) was added to attached HEK293 cells in a 6-well plate, and proteins were expressed for approximately 20 hours at 37°C and 5% CO2.
- Transfected HEK293 cells were collected and divided into two pools. For experimental samples, 1μl of 0.1mM HaloTag® NanoBRET® 618 Ligand was added per milliliter of cells (100nM final concentration). For no-acceptor controls, 1μl of DMSO was added per milliliter of cells (0.1% DMSO final concentration).
- One hundred microliters of each pool of the cells was re-plated into multiple wells of a 96-well plate and incubated at 37°C and 5% CO2 overnight for ~20 hours.
- Twenty-five microliters of diluted NanoBRET® Nano-Glo® Substrate was added to cells and donor emission (460nm) and acceptor emission (618nm) was measured using the GloMax® Discover plate reader.
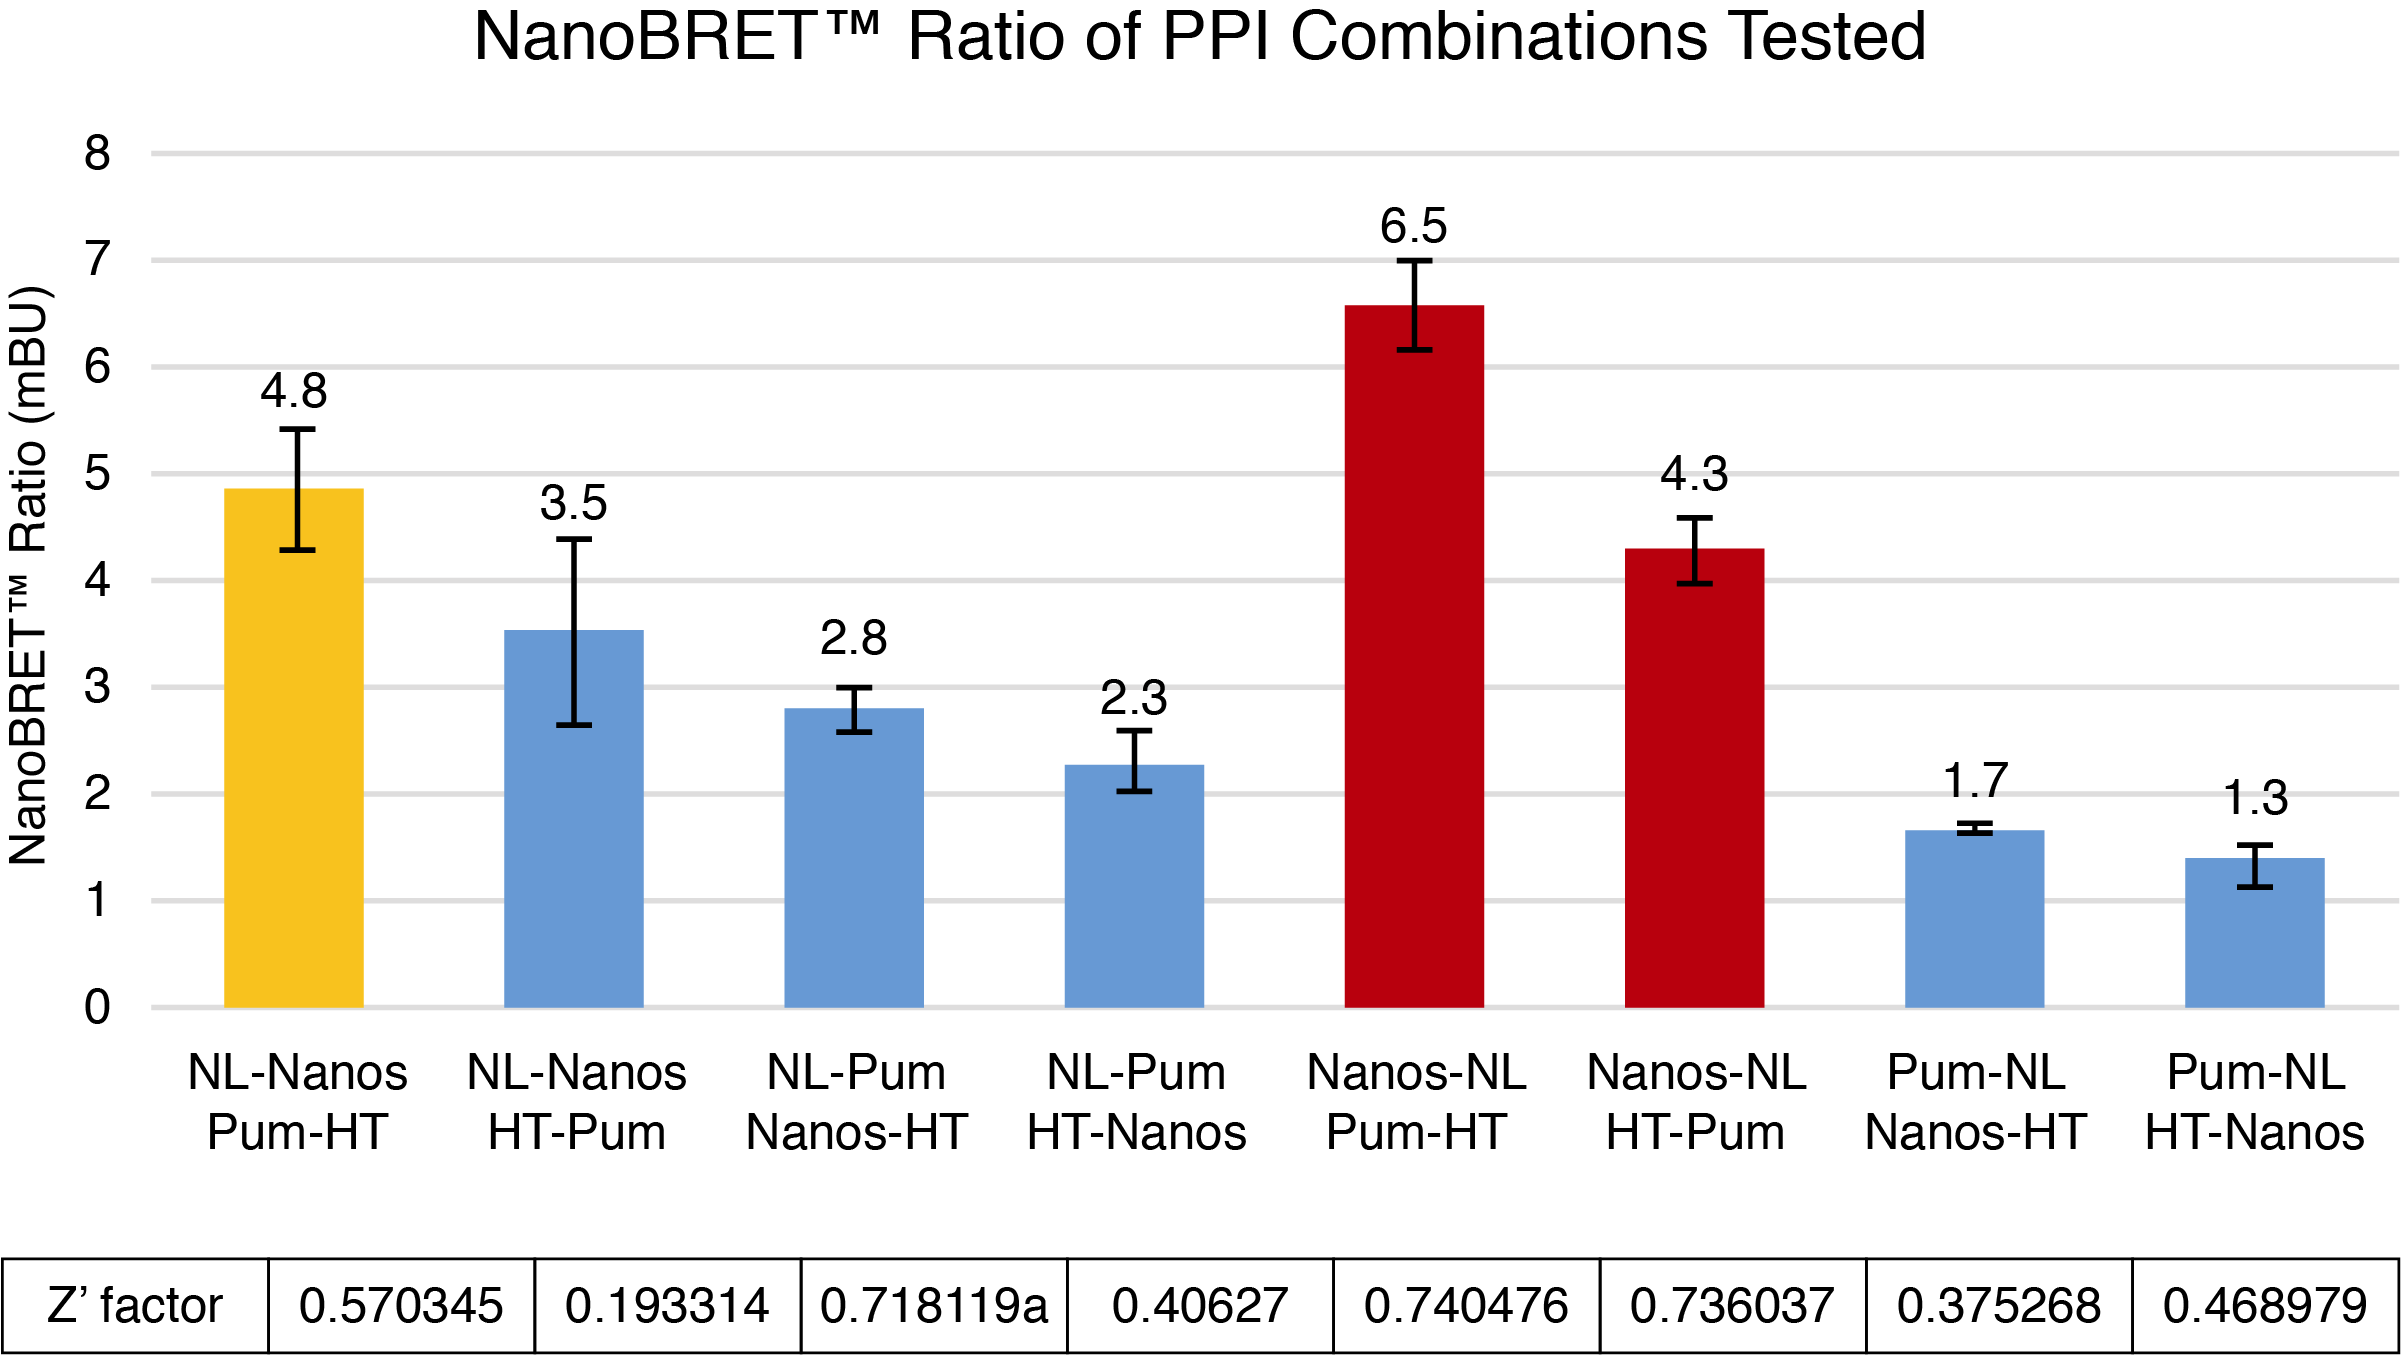
To calculate NanoBRET® ratios, the acceptor emission value for each pair was divided by the donor emission value, and these raw values were multiplied by 1,000 to convert to milliBRET units (mBU). The mean corrected mBU was then calculated by subtracting the mean mBU of the no ligand control from the mean mBU of the experimental sample. In order to determine assay consistency, a statistic known as a
Z´ factor was calculated comparing the mean and standard deviation values of the experimental samples and the no ligand control. The closer the calculated Z´ factor is to 1, the higher the quality of the assay, with an assay value between 0.5–1 considered to be in the acceptable range for signifying low variability.
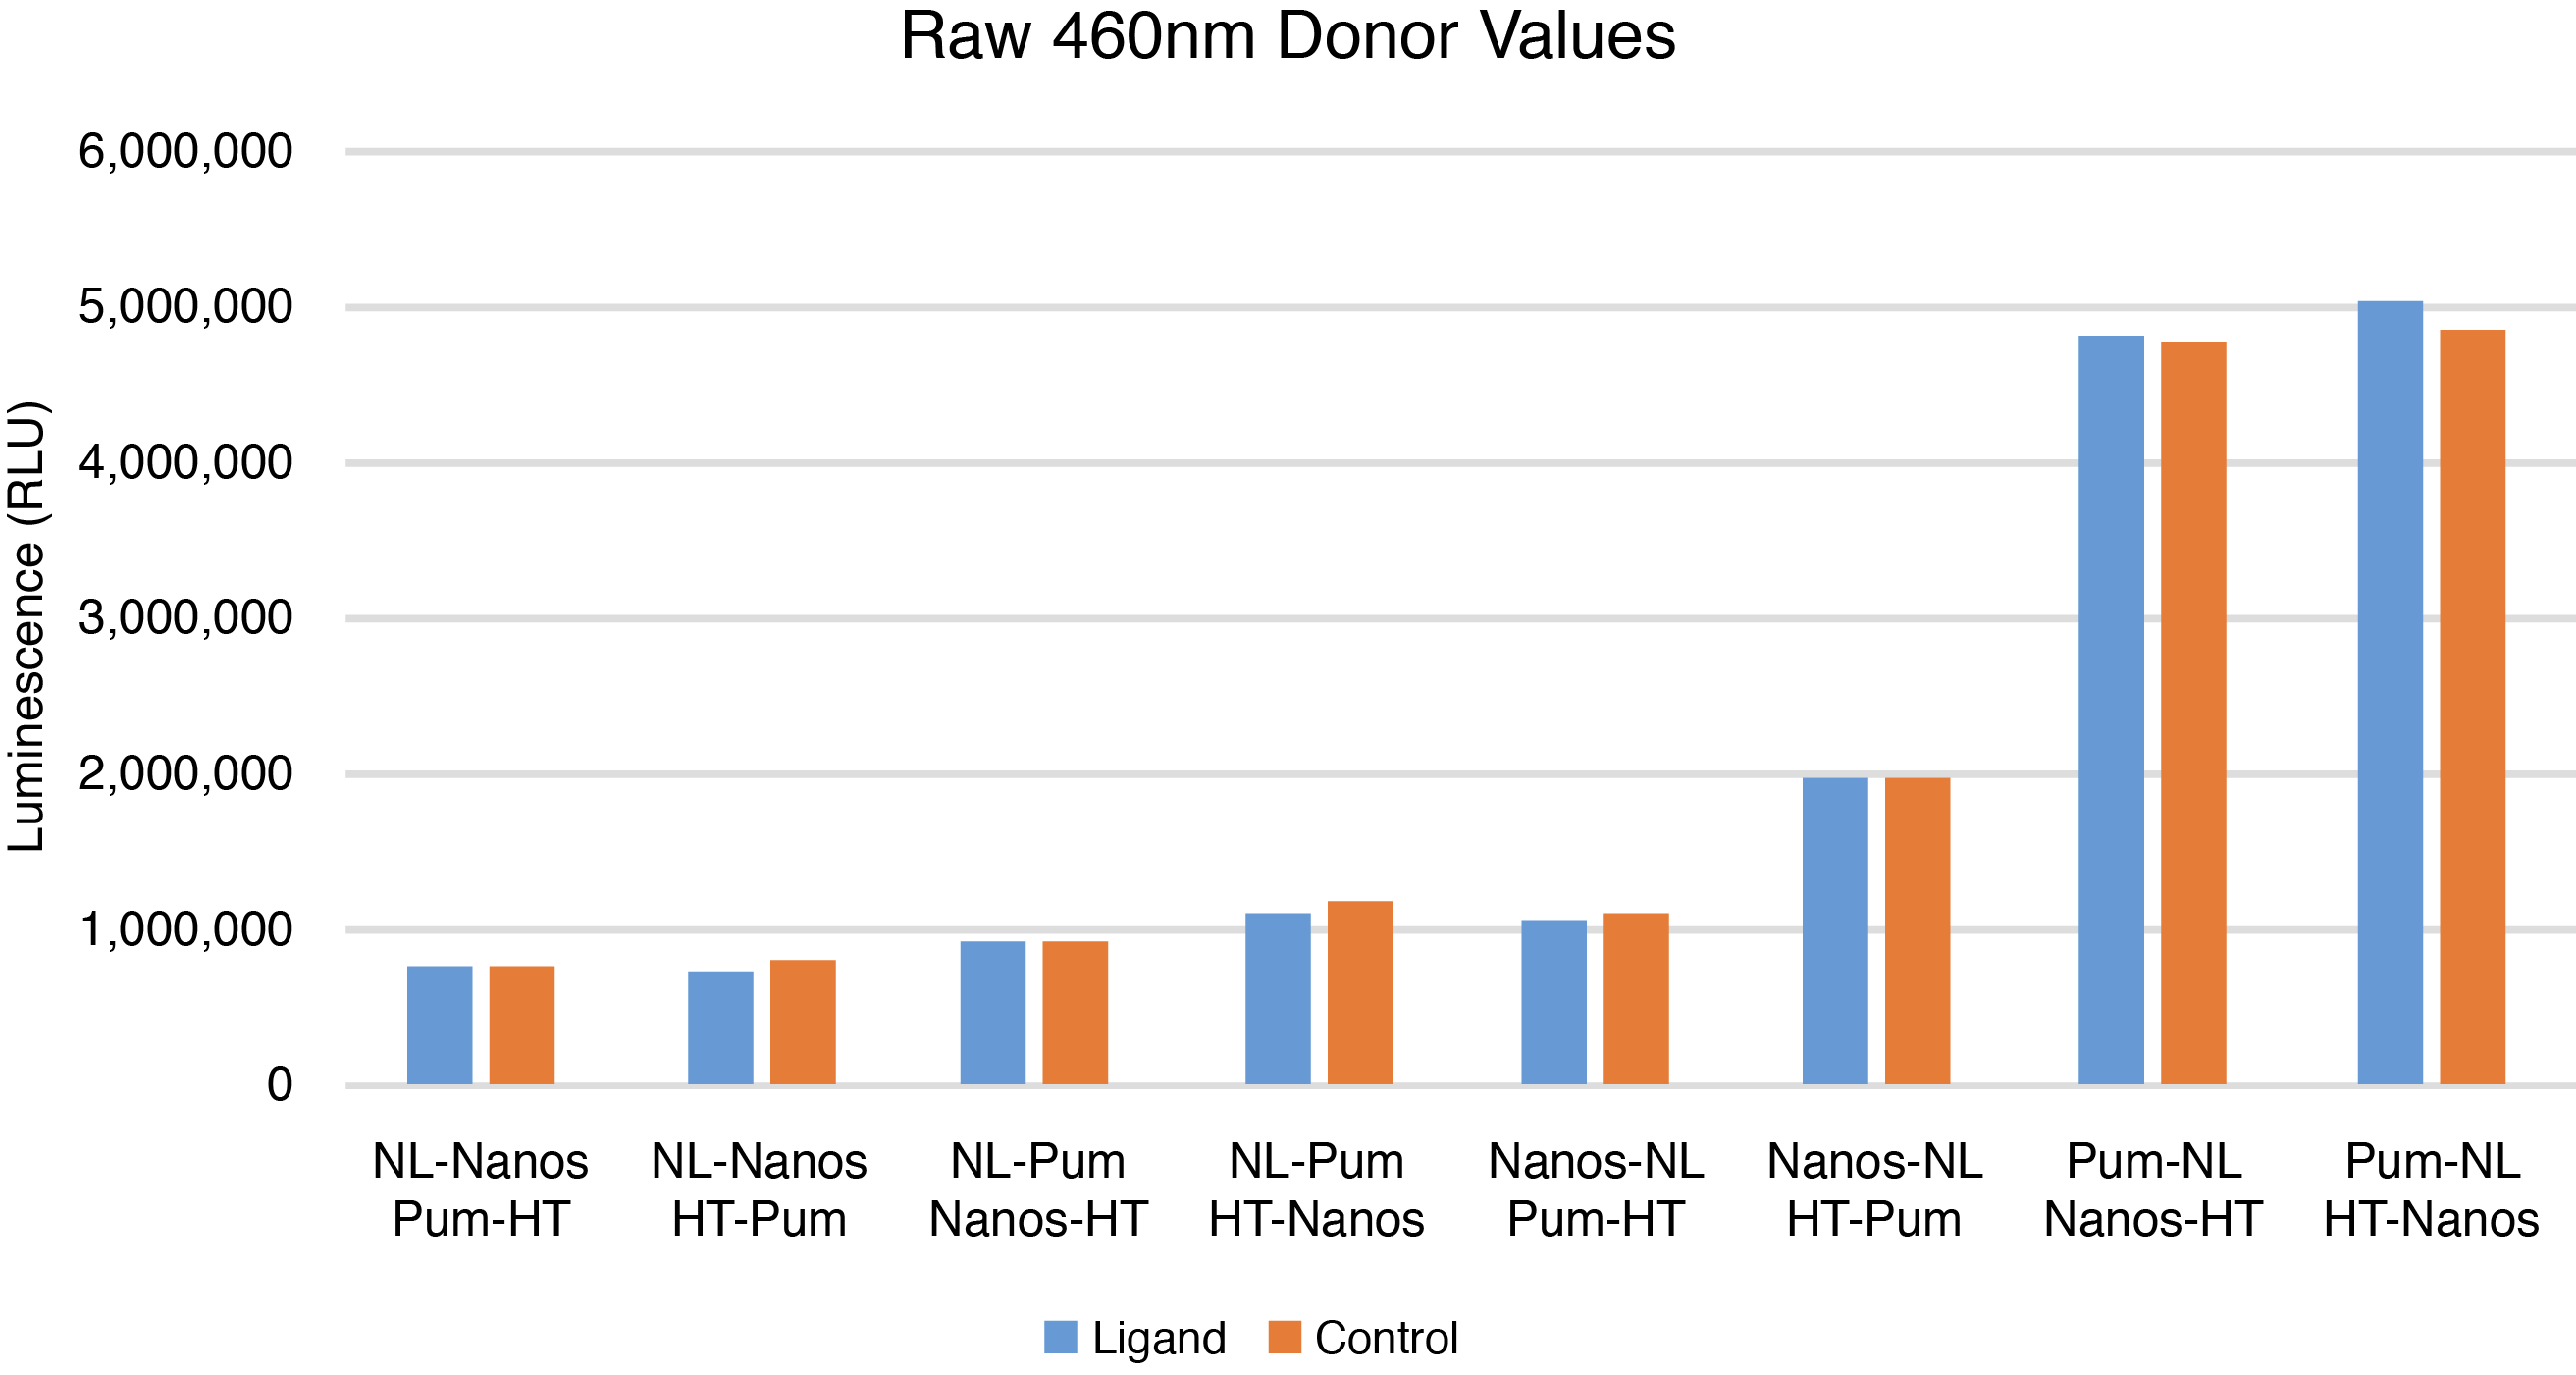
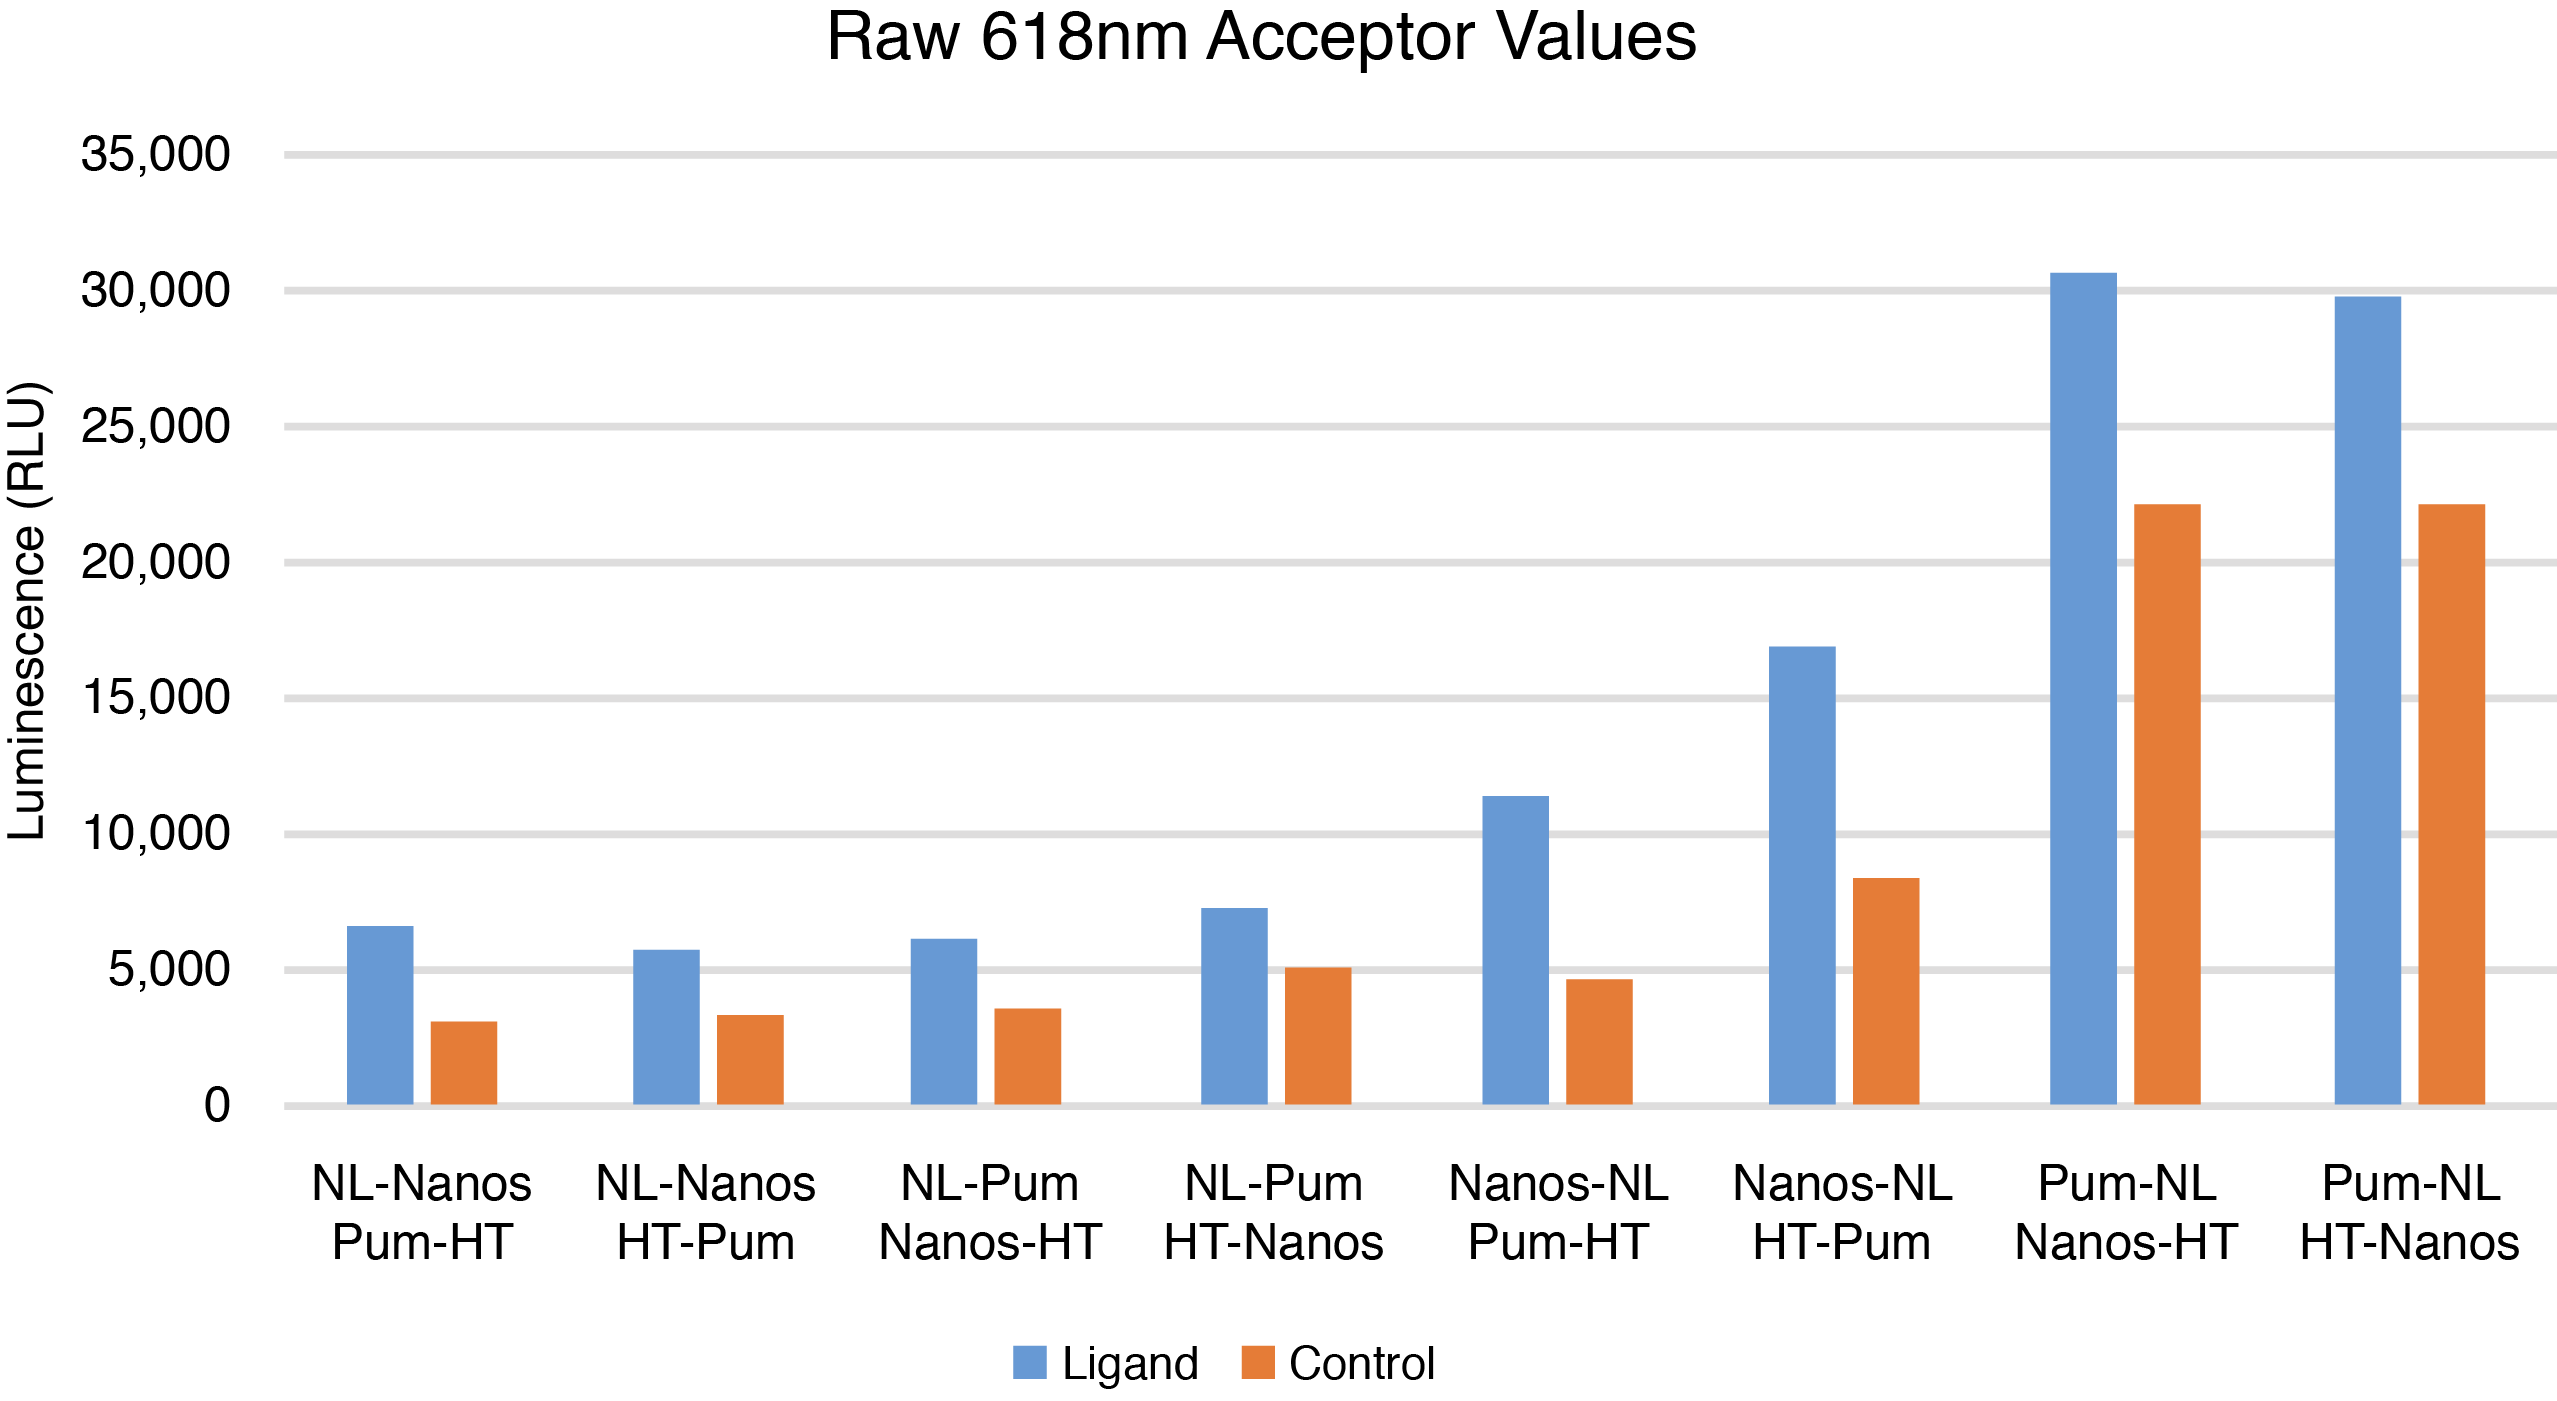
The combinations of C-terminal NLuc-tagged Nanos-ZC with N or C-terminal HT-tagged Pum-RBD were chosen for further optimization based on calculated BRET ratios, raw donor and acceptor values, and Z’ factor calculations (Figures 1–3). Although the combination of N-terminal NLuc-tagged Nanos-ZC with C-terminal HT-tagged Pum-RBD yielded a similar BRET ratio, it was not chosen due to reduced donor and acceptor values and a lower Z´ factor calculation.
Since in vitro data suggested that Pum and Nanos interactions required the presence of RNA containing NRE binding sites in the 3´ UTR, modulators consisting of psiCHECK™ vectors containing NREs were co-transfected along with the Pum-RBD and Nanos-ZC tagged vectors. Subsequent experiments resulted in no significant difference in the NanoBRET® ratios with co-transfection of the wild-type or mutant psiCHECK™ NRE RNA vectors as well as in the absence of the vector, suggesting that the presence of the RNA modulator from the psiCHECK™ expression vector is not required for PPI. Native NRE sites in RNA in HEK293 cells may be able to provide binding sites for the Drosophila Pum-RBD and Nanos-ZC proteins expressed, eliminating the need for additional NRE RNA to be present.
What Happens If I Don't Detect an Interaction?
Not all is lost. For troubleshooting, one of the obvious places to look at is the sequences of the constructs that were generated. While cloning may sometimes be considered a trivial step in experimental workflows, errors can and will occur. Mutations can be introduced if PCR was used for the initial cloning of the genes of interest. Thus, the use of a high-fidelity polymerase is recommended with any PCR-based cloning step. Are the sequences of interest in proper reading frame with the tags or were any extraneous stop codons introduced accidentally? DNA sequencing should be performed on all constructs to be tested to confirm that the correct sequences are present and in frame.
Even if the sequences are correct, oftentimes the expression levels of constructs can vary. It is important that the proteins of interest are expressed well, and this can easily be confirmed by SDS PAGE or Western blot analysis. If antibodies to the proteins of interest are not available, antibodies to HaloTag® and NanoLuc® could also be used. In addition, the expected size of the protein expressed should be confirmed considering the added sizes of the HaloTag® (34kDa) and NanoLuc® (19kDa) tags are also present. And finally, are the proteins folded properly and are they functional? This is probably the most difficult to test, but if functional assays are available for the individual proteins of interest, it may be worth the time and effort if an expected PPI is not detected.
Optimizing the NanoBRET® Assay
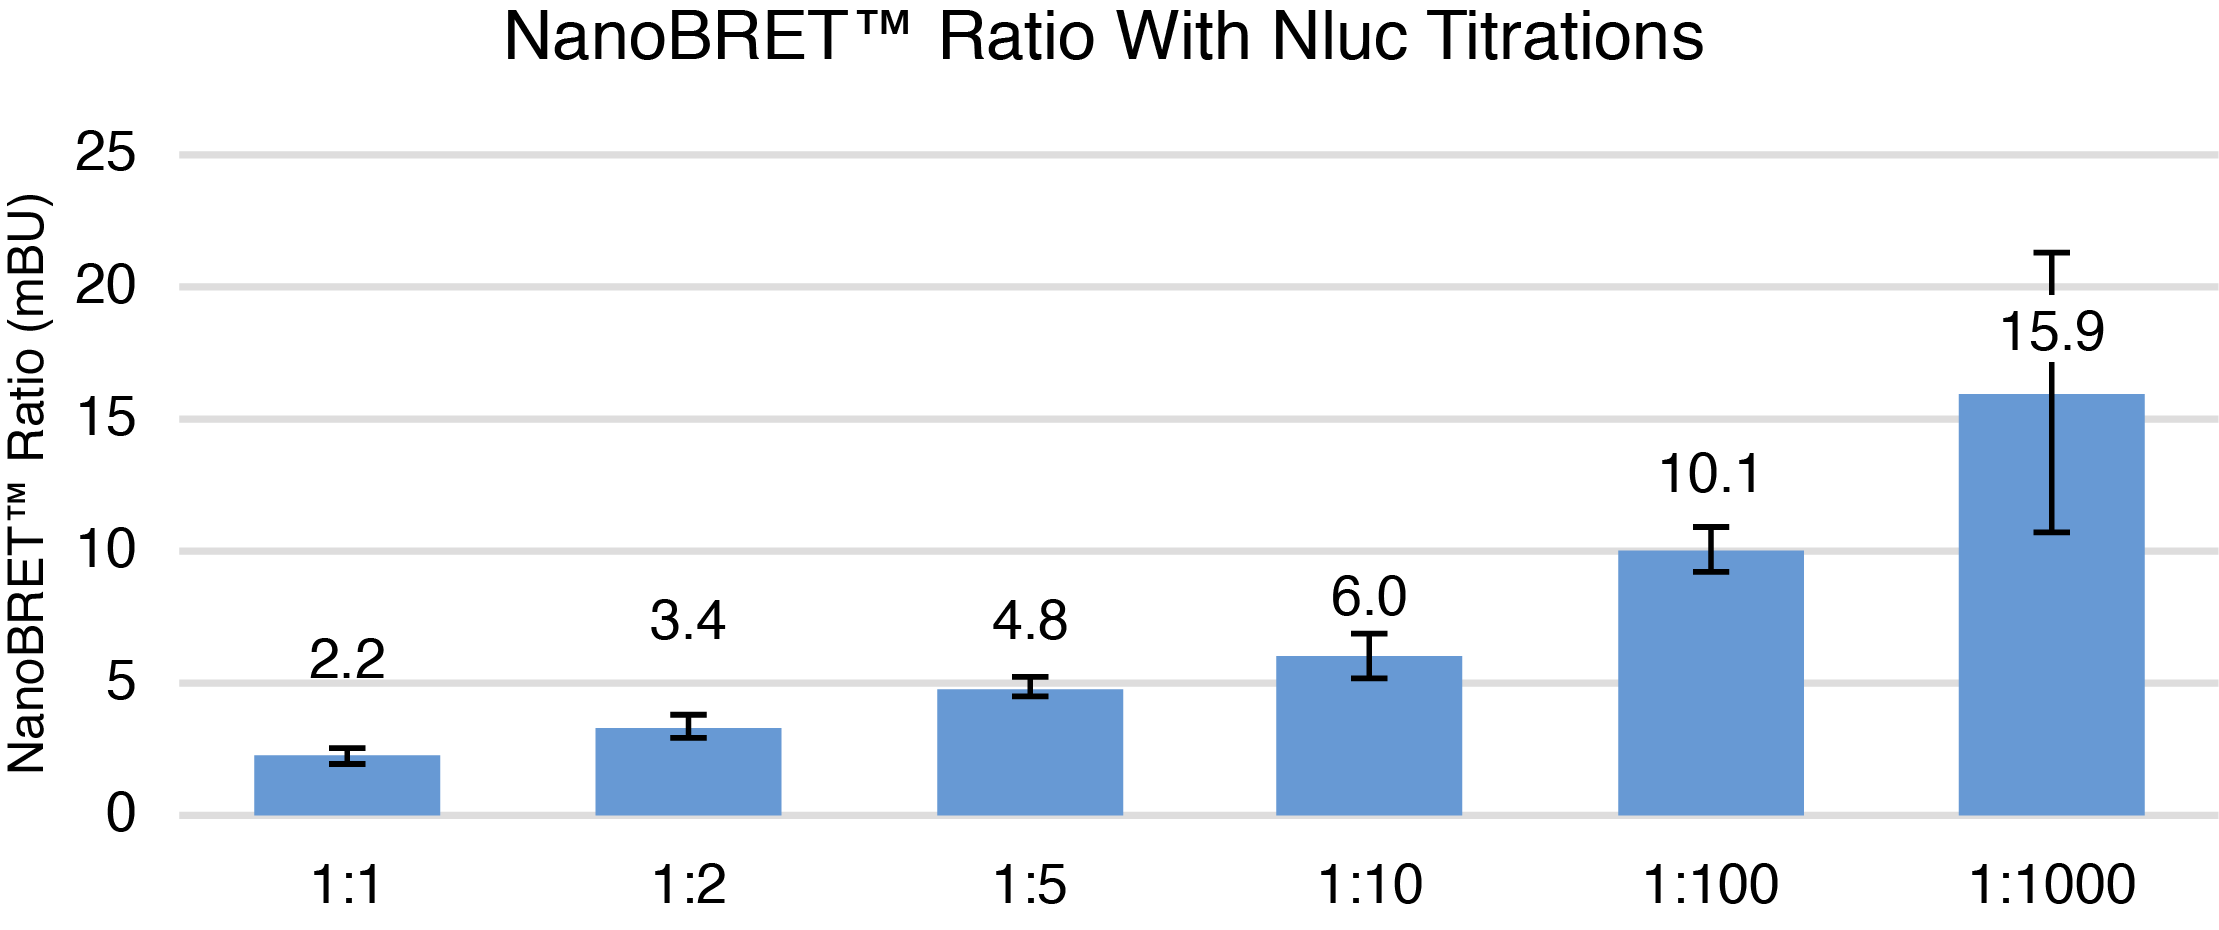
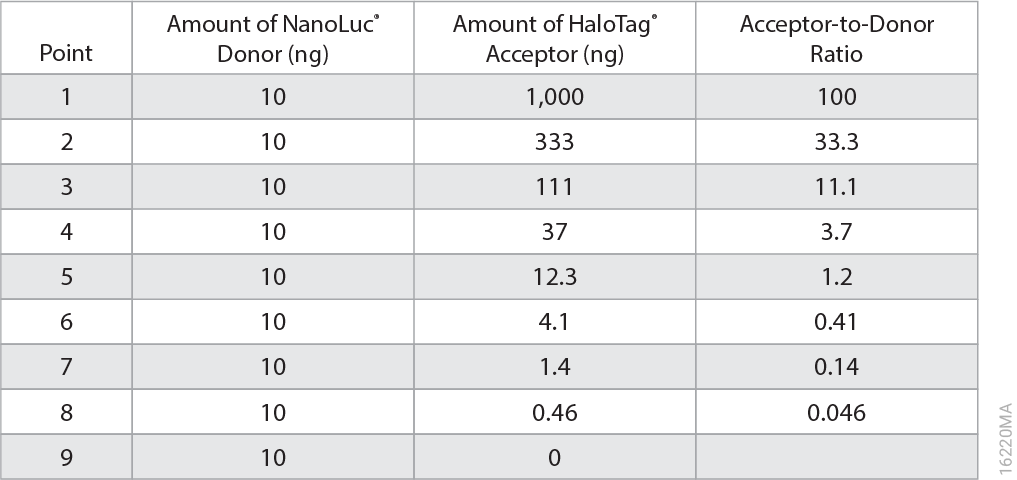
The NanoBRET® assay can be further optimized using the best PPI combination for optimal donor and acceptor DNA ratio to minimize unbound donor and maximize dynamic range by titration of the NLuc donor. In other words, we want to increase the sensitivity of the assay. For our Pum and Nanos example, the NanoLuc® vector (C-terminal tagged Nanos-ZC) was diluted 1:2, 1:5, 1:10, 1:100, and 1:1000. Transfection mixtures consisting of 1μg of HaloTag® vector (C-terminal tagged Pum-RBD) and titrated NanoLuc® vector were created. As the amount of NLuc vector was decreased, the NanoBRET® ratios increased (Figure 4). Raw donor and acceptor values also decreased with decreasing amounts of Nluc vector as expected. The highest NanoBRET® ratio was seen with the 1:1000 dilution, however, assay variability was high. Thus, the 1:100 NLuc to HT DNA ratio was chosen for further testing as it showed a high NanoBRET® ratio with high assay consistency based on Z´ factor calculations.
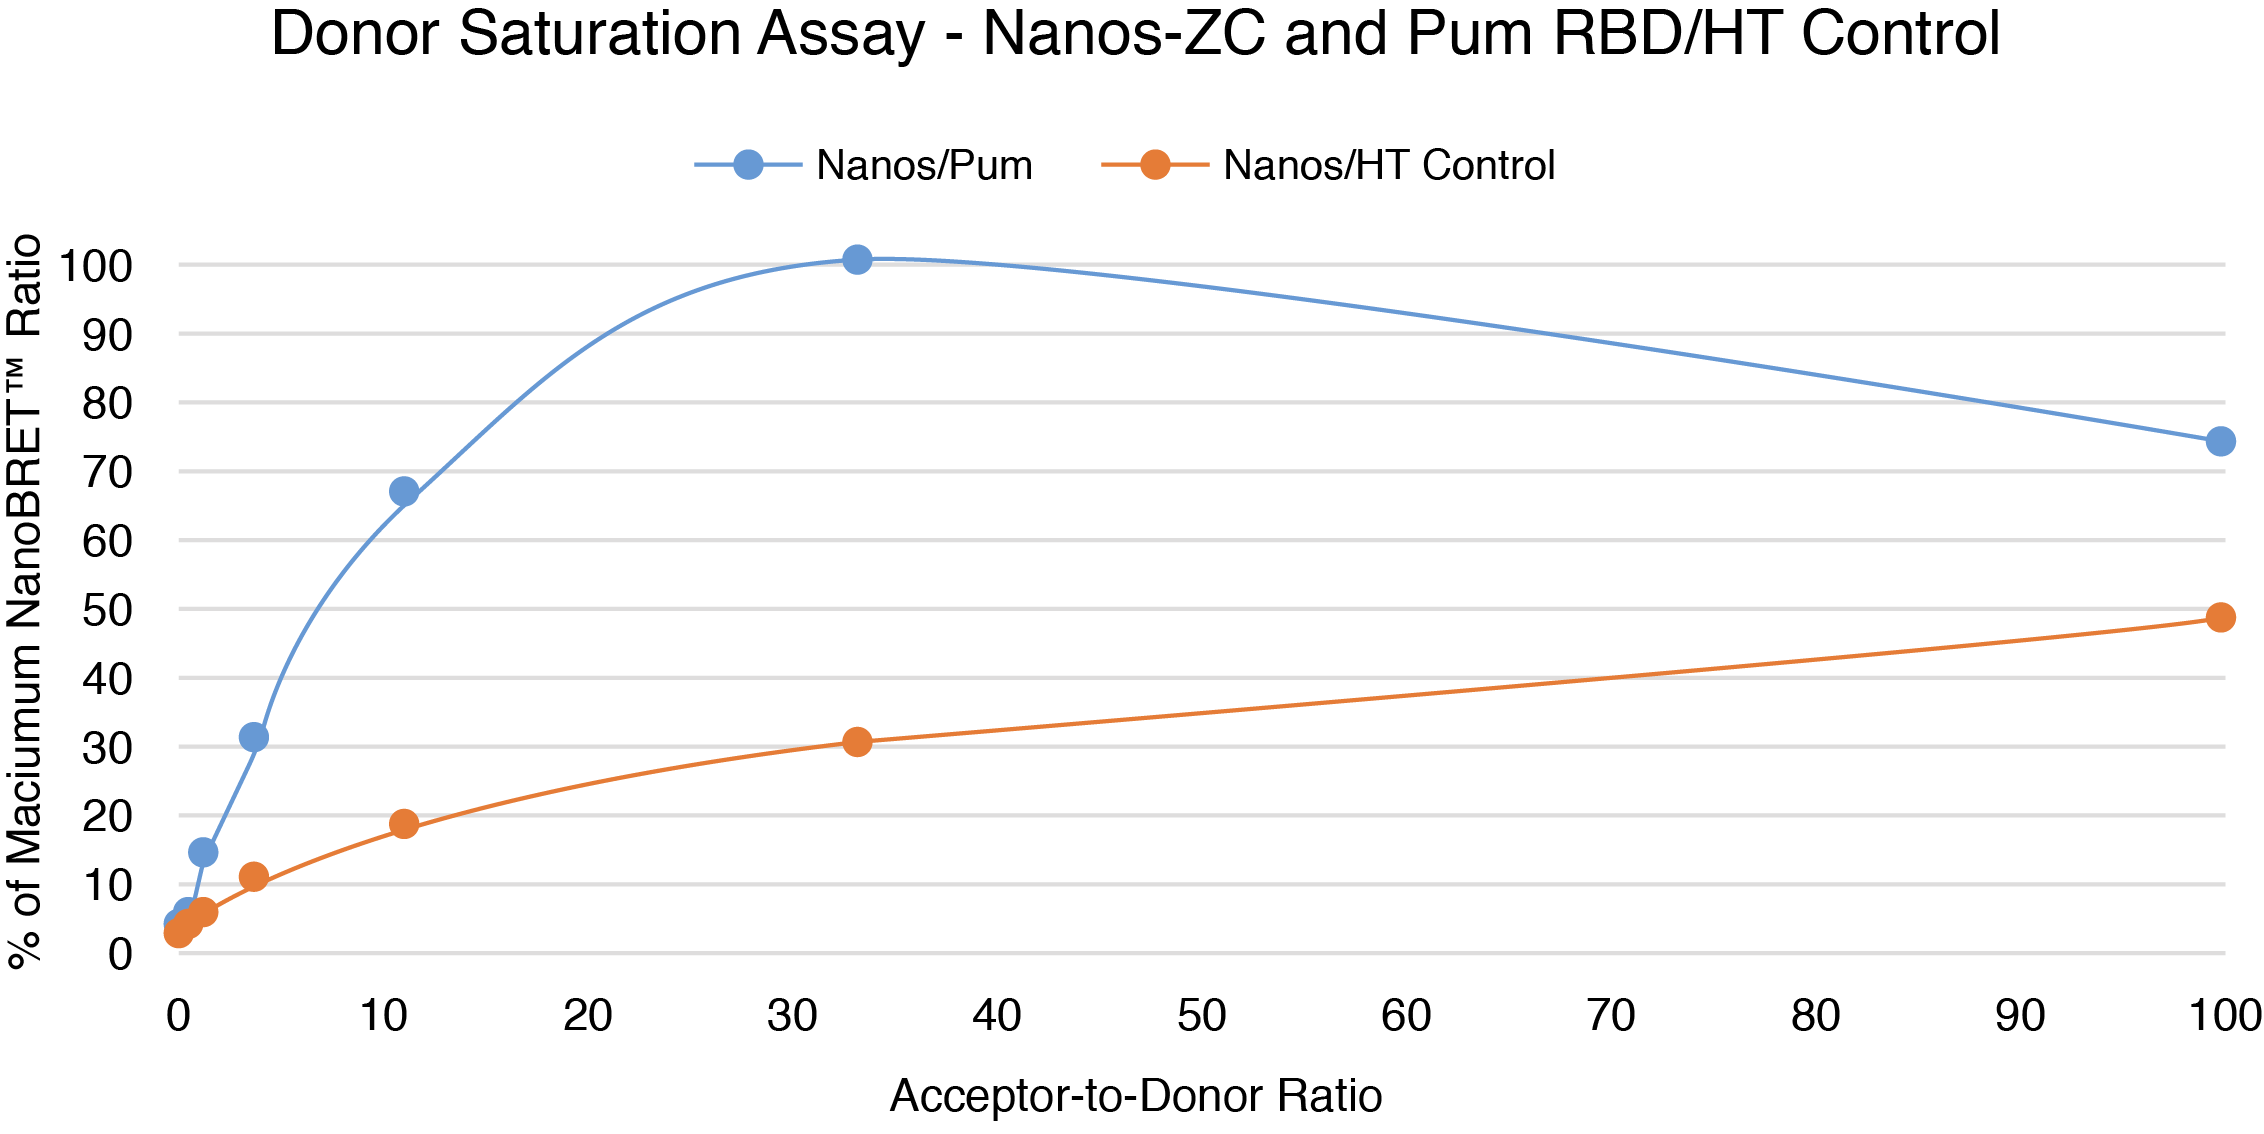
Determining Interaction Specificity
Conclusion
By following a few specific guidelines and including the proper controls, the NanoBRET® assay has provided further evidence of a Nanos-ZC and Pum-RBD protein:protein interaction in vivo.
Here is a summary of the key elements that went into building this assay:
- Make certain that proper instrumentation capable of sequentially measuring filtered luminescence and filtered fluorescence is available for NanoBRET® detection.
- Construct NanoBRET® expression vectors incorporating all possible combinations of protein, tag, and terminus, pair up the eight possible tagged combinations of the proteins of interest, and then determine which of the pairs resulted in the best energy transfer.
- Ensure that all necessary elements required for the PPI are present in the assay, including any essential modulators.
- If issues arise, use high-fidelity polymerases during cloning, confirm constructs are correct and in-frame by sequencing, and analyze protein expression levels.
- Further optimize the assay using the best PPI combination for optimal donor and acceptor DNA ratio to minimize unbound donor and maximize dynamic range by titration of the NLuc donor.
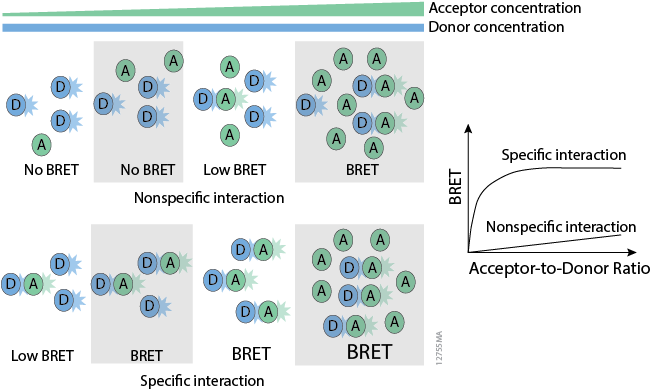
- Validate the assay and confirm the specificity of the PPI by performing the NanoBRET® Donor Saturation Assay or use a known modulator.
References
- Weidmann et al. (2016). Drosophila Nanos acts as a molecular clamp that modulates the RNA-binding and repression activities of Pumilio. eLife 5:e17096.
The NanoBRET® PPI Starter Systems provide the vectors required to create NanoLuc® Luciferase and HaloTag® protein fusions to target proteins of interest, a Positive Control Pair (p53, MDM2) and the NanoBRET® Nano-Glo® Detection System, which contains the substrate used by NanoLuc® Luciferase to generate the donor signal and the HaloTag® NanoBRET® 618 Ligand for the fluorescent energy acceptor.