Apoptosis
This chapter of the Protocols and Applications Guide explains the molecular mechanisms of apoptosis, how to confirm apoptosis, and the use of multiplexed assays using a single sample.
Introduction
Cell Death as Cell Fate: Historical Context
Although apoptosis is often described as a "hot topic" or a "new and exploding" area of biological research, the concept of cell death as a normal cell fate was articulated only three years after Schleiden and Schwann introduced the Cell Theory when, in 1874, Vogt described natural cell death as an integral part of toad development (Cotter and Curtin, 2003). Since these early observations, natural cell death has been described "anew" several times. In 1885 Flemming provided the first morphological description of a natural cell death process, which we now label "apoptosis", a term coined by Kerr and colleagues to describe the unique morphology associated with a cell death that differs from necrosis (Kerr et al. 1972). The revolution that has occurred in apoptosis research is a direct result of a better understanding of the genetic program and biochemical mechanisms of apoptosis.
In the 1970s and 1980s, studies revealed that apoptosis not only had specific morphological characteristics but that it was also a tightly regulated process with specific biochemical characteristics. Studies of cell lineage in the nematode, Caenorhabditis elegans, showed that apoptosis was a normal feature of the nematode's invariant developmental program. Of the 1,090 somatic cells of the C. elegans adult hermaphrodite, 131 die during normal development (Hengartner, 1997). By documenting every cell division from the zygote to the adult, researchers discovered that the lineage and the timing of apoptosis for each of these 131 cells were constant, demonstrating that apoptosis was a tightly regulated process, presumably genetically programmed (i.e., programmed cell death). At the biochemical level, Wyllie showed that DNA degradation by a specific endonuclease during apoptosis resulted in a DNA ladder composed of mono- and oligonucleosomal-sized fragments (Wyllie, 1980).
Morphology and Overview of Apoptosis
Morphologically, apoptosis is first characterized by a change in the refractive index of the cell (Hengartner, 1997) followed by cytoplasmic shrinkage and nuclear condensation. The cell membrane begins to show blebs or spikes (protrusions of the cell membrane), depending on cell type (Figure 3.1), and eventually these blebs and spikes separate from the dying cell and form "apoptotic bodies". Apoptotic cells also cease to maintain phospholipid asymmetry in the cell membrane, and phosphotidylserine (PS) appears on the outer leaflet (Williamson, 2000). The mitochondrial outer membrane (MOM) also undergoes changes that include loss of its electrochemical gradient, possibly by the formation of pores in the MOM, and substances such as cytochrome c leak from the MOM into the cytoplasm. Finally, adjacent cells or macrophages phagocytose apoptotic bodies and the dying cell. The apoptotic cell does not provoke an inflammatory response, and only individual cells are affected by apoptosis in vivo.
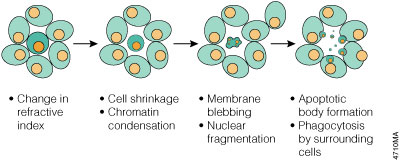
Figure 3.1. Morphology changes during apoptosis. The cell membrane begins to show blebs or spikes, depending on cell type. Eventually these separate from the dying cell and form "apoptotic bodies" that are phagocytosed by neighboring cells.
The events of apoptosis stand in contrast to necrosis, which is first marked by a loss of cell membrane integrity. The cytoplasm and mitochondria of the necrotic cell swell, and ultimately the cell and many of its internal organelles lyse. There is no vesicle or apoptotic body formation, and often necrosis affects groups of adjacent cells. The necrotic cell remnants are phagocytosed by macrophages, and inflammatory responses are provoked in vivo.
Apoptosis and necrosis represent two extremes of a continuum of cell death. This continuum includes many variations. "Apoptosis-like programmed cell death" refers to a cell death process that has some of the hallmarks of apoptosis such as chromatin condensation and the appearance of PS on the outer leaflet of the cell membrane but does not necessarily require caspase activity (Leist and Jäättelä, 2001). "Necrosis-like programmed cell death" describes programmed cell death that does not include chromatin condensation and has varying degrees of other apoptotic features. Caspase-1 and caspase-8 have been implicated in some cases of this type of programmed cell death (Leist and Jäättelä, 2001). "Paraptosis" describes a cell death that requires gene expression but morphologically does not resemble either apoptosis or necrosis (Sperandio et al. 2000).
In addition, apoptotic cells cultured in vitro will eventually undergo "secondary necrosis". After extended incubation, apoptotic cells ultimately shut down metabolism, lose membrane integrity and release their cytoplasmic contents into the culture medium (Riss and Moravec, 2004). Therefore, cells that have initiated apoptosis may exhibit some of the morphological phenotypes associated with necrosis. Because programmed cell death takes many forms, both morphologically and biochemically, researchers need to examine multiple biochemical markers at carefully selected time points to determine the mechanism of cell death in their experimental system.
Molecular Players in Apoptosis
Caspases
Large-scale mutagenesis experiments in the nematode C. elegans identified mutations that disrupted the programmed cell death fates during development, the cell death abnormal (ced) genes (Hedgecock et al. 1983; Ellis and Horvitz, 1986). The gene ced-3 was cloned and found to encode a protease that contained a cysteine residue at the active site and cleaved its substrates after the amino acid aspartate (caspase; Yuan, J. et al. 1993). Genetic analysis showed that ced-3 was absolutely required for apoptosis in C. elegans.
Caspases constitute a large protein family that is highly conserved among multicellular organisms. The family can be divided into two major subfamilies: caspases that are involved primarily in inflammation and have homology to caspase-1 (Interleukin-1β-Converting Enzyme), and those caspases that are related to CED-3 and are primarily involved in apoptosis. Caspases are constitutively expressed in most cell types as inactive zymogens that are proteolytically processed before they gain full activity. The caspase zymogens contain several domains including an N-terminal prodomain, a large subunit and a small subunit. Caspase activation involves cleaving the zymogen at a specific aspartic acid in the region between the large and small subunits and removing the prodomain. The active site is formed by a heterodimer containing one large and one small subunit, and the fully active caspase protein is a tetramer composed of two heterodimers (Figure 3.2). Because caspases exist as zymogens, their activity is thought to be regulated primarily post-translationally. However recent studies indicate that expression of the caspase-9 gene is regulated transcriptionally as well (Csiszar, 2003), and endoplasmic reticulum (ER) stress can induce expression of mouse caspase-12 in transfected cells (Rao et al. 2001).
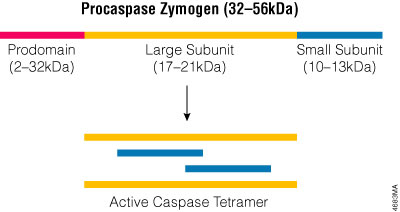
Figure 3.2. The active caspase enzyme. Caspase zymogens are cleaved between the large and small subunits, and the prodomains are removed. The active site is formed by a heterodimer that contains one large and one small subunit. Two heterodimers associate to form the fully active tetramer.
Human caspase-8 and caspase-9 are involved in initiating apoptosis through two different signaling mechanisms and are known as "initiator caspases." They can activate the effector caspases, including caspase-3, by proteolytic processing. In turn, caspase-3 cleaves downstream targets and irreversibly commits the cell to the apoptotic fate.
Bcl-2 Family Proteins
The gene ced-9 protects against apoptosis in C. elegans, and genetic loss of function of ced-9 leads to increased apoptosis (Hengartner et al. 1992). The ced-9-encoded protein is homologous with the bcl-2 gene, a proto-oncogene involved in human lymphoma (Tsujimoto and Croce, 1986). The conservation of function of ced-9 and bcl-2 is demonstrated by transgenic experiments in which the human bcl-2 gene rescues the ced-9 loss-of-function phenotype in C. elegans mutants (Hengartner and Horvitz, 1994). The Bcl-2 protein family includes a large number of proteins that share common Bcl-2 homology (BH) domains. Structurally, the Bcl-2 proteins can be divided into three groups. Group I proteins include Bcl-2, and these proteins are anti-apoptotic. Group II and III family members are pro-apoptotic. The group II family members contain all three of the BH domains; the group III family members contain only the BH-3 domain. The pro-apoptotic members of the Bcl-2 family are implicated in permeabilizing the MOM and allowing leakage of mitochondrial proteins such as cytochrome c. The anti-apoptotic members of the protein family, such as Bcl-2, appear to protect cells from apoptosis by sequestering pro-apoptotic proteins or interfering with their activity (Daniel et al. 2003).
Activating Apoptosis
Apoptosis can be induced in response to many external stimuli (extrinsic pathway) including activation of cell surface receptors such as Fas, TNFR1 (tumor necrosis factor receptor 1), TRAIL-R1 (TNF-related apoptosis-inducing ligand receptor 1), TRAIL-R2, p75-NGFR (p75-nerve growth factor receptor) and others (Wajant et al. 2003). These "death receptors" have two distinct signaling motifs: death domains (DD) and death effector domains (DED) that allow them to interact with other proteins involved in the apoptosis cascade. Typically the extrinsic pathway involves activating the initiator caspase, caspase-8, which in turn either activates caspase-3 or cleaves the Bcl-2 family member, Bid, leading to the formation of the apoptosome and activation of caspase-9 (Hengartner, 2000). The alternative mitochondrial pathway (intrinsic pathway) can be activated by events such as DNA damage (Rich et al. 1999). The mitochondrial pathway involves members of the Bcl-2 family that regulate cytochrome c release from the mitochondria.
Other studies have suggested that a third pathway for activating apoptosis may involve the endoplasmic reticulum. In mice, caspase-12 has been implicated in an ER stress pathway that induces apoptosis (Nakagawa et al. 2000). Caspase-12 in the mouse localizes to the ER and is cleaved in response to ER stress such as the accumulation of unfolded proteins in the ER (Nakagawa et al. 2000). Mouse caspase-12 activation appears to be mediated by calpain, and Ca2+ homeostasis may be an important indicator of cell health (Rao et al. 2001). Caspase-12-deficient mice show less sensitivity to amyloid beta (Aβ)-induced cell death (Nakagawa, 2000), suggesting that the ER may be involved in Aβ-induced cell death pathways. The amyloid plaques characteristic of Alzheimer’s disease contain Aβ fragments. These Aβ fragments are neurotoxic and are implicated in many neurodegenerative diseases (Yuan and Yankner, 2000). Enzymatic activity has not been demonstrated for human caspase-12, but neuroblastoma cells expressing mouse caspase-12 are more sensitive to ER stress (Hitomi et al. 2003). Screens for human genes closely related to caspase-12 have identified human caspase-4 as a potential candidate for activating apoptosis through an ER stress pathway (Hitomi et al. 2004). Caspase-4 is cleaved when cells are treated with ER stress-inducing agents, and caspase-4 localizes to the ER and mitochondria in SK-N-SH neuroblastoma and HeLa cells (Hitomi et al. 2004). Treating cells with caspase-4 siRNA increases their resistance to ER stress-induced apoptosis and also increases the resistance of SK-N-SH cells to Aβ-induced cell death (Hitomi et al. 2004).
Fas: An Example of the Death Receptor Pathway
Extrinsic signaling at the cell surface can be initiated by aggregation of Fas receptors when they bind to the multivalent Fas Ligand (FasL). This aggregation brings the cytoplasmic domains of the membrane receptors into close proximity and induces a conformational change that allows the assembly of a signaling complex, the death inducing signaling complex (DISC; Figure 3.3), at the cytoplasmic tail of the receptors. Some studies have suggested that the death receptors may be pre-aggregated in the membrane through interaction of pre-ligand-binding assembly domains (PLAD; Chan et al. 2000; Siegel, et al. 2000). The DISC comprises the receptors and ligand as well as an "adaptor" protein, Fas associated death domain protein (FADD), that binds through its C-terminal DD to the ligand-bound receptor and recruits procaspase-8. Procaspase-8 in turn binds to the DED of FADD via its own N-terminal DED domains. As a consequence of DISC formation at ligand-bound receptors, several molecules of procaspase-8 are brought into close proximity, resulting in high local concentration of procaspase-8. One hypothesis suggests that the low intrinsic activity of procaspase-8 allows the procaspase-8 zymogens to cleave and activate each other (induced proximity activation; Hengartner, 2000). Induced proximity activation has also been proposed for human caspase-2 and nematode CED-3 (Hengartner, 2000). However, other studies have suggested that the activation of caspase-8 requires dimerization (Boatright et al. 2003). Active caspase-8 heterotetramers are released from DISC and are free to cleave and activate the effector caspase, caspase-3. An animated presentation illustrating the death receptor pathway is available. In some cells caspase-8 leads to an amplification loop that involves caspase-8 cleavage of the Bcl-2 protein family member, Bid. When Bid is cleaved it can induce Bax-mediated release of cytochrome c from the mitochondria, further committing the cell to the apoptosis fate.
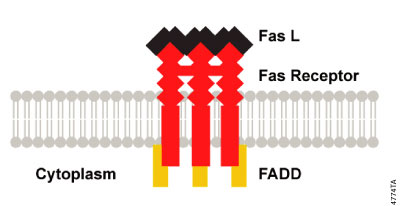
Figure 3.3. DISC Formation. Aggregation of activated death receptors brings the cytoplasmic domains into close proximity and induces a conformational change that allows the assembly of the death inducing signaling complex (DISC) at the cytoplasmic tail of the receptors.
The Mitochondrial Pathway (Intrinsic)
The mitochondrial pathway involves members of the Bcl-2 family of proteins and can be activated by the death receptor pathway (Section I.E) or by other stimuli that are independent of death receptors including DNA damage, topoisomerase inhibition or withdrawal of trophic factors (Parone et al. 2003). Many of the Group II and Group III Bcl-2 family members, such as Bax, Bad and Bid, shuttle between the mitochondria and the other parts of the cell. Their activity is regulated by a variety of mechanisms including proteolytic processing, phosphorylation and sequestration by inhibitory proteins.
Pro-apoptotic signals direct the Group II and III Bcl-2 family proteins to the mitochondria where the pro-apoptotic members interact with anti-apoptotic Bcl-2 family members including Bcl-2 and Bcl-XL to determine whether or not apoptosis will be initiated. If the pro-apoptotic proteins "win," cytochrome c and other molecules are released from the MOM. Once cytochrome c is released from the mitochondria, it can interact with Apaf-1 (a mammalian homolog of C. elegans CED-4; Zou et al. 1997), dATP and procaspase-9 in a protein complex called the apoptosome. Caspase-9 is processed and activated when it is part of the apoptosome, where it can cleave and activate caspase-3. An animated presentation illustrating the mitochondrial pathway is available.
Clinical Applications of Apoptosis Research
Many diseases—cancers, autoimmune diseases and neurodegenerative diseases, including Alzheimer's Huntington's, and ALS—demonstrate either a failure of apoptosis to eliminate harmful cells or the inappropriate activation of apoptosis leading to loss of essential cells. The complexity of apoptosis regulation and the large numbers of molecular players in the apoptotic signaling pathways provide ample opportunity for developing therapeutics to modulate the pathway. Potential therapeutic strategies include small molecules that inhibit or activate specific proteins involved in the pathway, antisense oligos directed against specific genes involved in apoptosis, and antibodies that can oligomerize cell membrane receptors to modulate the pathway, among others (Murphy et al. 2003).
One obvious target for modulating apoptosis is the caspase family of proteins. The natural delay in activation of the caspases after injury allows time for treatment, and molecules that target the caspases have shown therapeutic potential in preclinical animal models (Reed, 2002; Nicholson, 2000). In mouse models of ischemic injury, active site inhibitors of caspases have been used and result in decreased apoptosis and increased survival and organ function (Nicholson, 2000; Hayakawa et al. 2003). Caspase inhibitors have also been used to treat sepsis in mouse models. In these models, caspase inhibition decreased lymphocyte apoptosis and improved survival rates. One pharmaceutical company, Vertex, has a caspase inhibitor in preclinical trials for treating sepsis (Murphy et al. 2003).
Molecules called "inhibitors of apoptosis" or IAPs are also potential therapeutic targets. These proteins, which function to suppress apoptosis, are evolutionarily conserved. Some cancers overexpress IAPs, and IAP expression is associated with resistance to apoptosis (Reed, 2002). Survivin is an IAP that has been associated with many human cancers, including lung cancer and malignant melanoma (Nicholson, 2000). Eliminating survivin activity has the potential of rendering cancer cells more sensitive to drugs that initiate apoptosis. IAPs are also being investigated in gene therapy strategies as a way of preventing excessive cell loss after stroke (Reed, 2002).
Both the death receptor and mitochondrial pathways present potential therapeutic targets as well. Normal and cancer cells show different sensitivities to TRAIL-mediated apoptosis, with approximately 80 percent of human cancer cell lines being sensitive to TRAIL-mediated apoptosis (Nicholson, 200). In studies where TRAIL (Apo-2L) was administered with cisplatin or etoposide, cancer cells showed increased apoptosis (Nicholson, 2000). In experiments with SCID mice, recombinant TRAIL was able to slow the growth of tumors after transplantation or decrease the size of established tumors. Recombinant TRAIL also showed lower liver toxicity than CD95 ligand or TNF-α (Nicholson, 2002).
The Bcl-2 family members that play essential roles in the mitochondrial pathway are also being targeted by drug companies. Bcl-2 protein is upregulated in many cancer cells. An antisense Bcl-2 oligo has shown promise in preclinical trials in SCID mice and in Phase III clinical trails (Nicholson, 2000; Reed, 2002). Bad is a pro-apoptotic Bcl-2 family member that is implicated in neuronal apoptosis. It is a substrate of calcineurin/calmodulin-dependent phosphatase, and dephosphorylation of Bad allows Bad to bind and neutralize the anti-apoptotic protein Bcl-XL. Current therapeutics that target this part of the apoptotic pathway include active site inhibitors of calcineurin and compounds like the NMDA receptor antagonist, memantine, that prevent calcium influx. Memantine is in clinical trials for treatment of Alzheimer's disease and multi-infarct dementia (Reed 2002).
Many other regulators and players in the apoptotic signaling pathways are also being targeted for developing therapeutics. There are many signaling cascades in cells that influence the decision of a cell to undergo apoptosis. Modifying these signaling inputs is another way to influence cell fate. MAPK family members, JUN kinases, and AKT kinase pathways all provide ways for potentially modulating inputs into apoptosis pathways of target cells (Reed, 2002; Murphy et al. 2003; Nicholson, 2000).
Much remains to be understood about the precise regulation of natural cell death. Understanding these cell death pathways will provide opportunity to influence and modulate cell death signaling so that inappropriate cell death can be prevented or inappropriately dividing cells can be killed using the cell's own molecular machinery.
Methods and Technologies for Detecting Apoptosis
Apoptosis occurs via a complex signaling cascade that is tightly regulated at multiple points, providing many opportunities to evaluate the activity of the proteins involved. The initiator and effector caspases are particularly good targets for detecting apoptosis in cells. These ubiquitous enzymes exist as inactive zymogens in cells and are cleaved before forming active heterotetramers that drive apoptotic events. Luminescent and fluorescent substrates for specific caspases have allowed the development of homogeneous assays to detect their activity. Additionally, specific antibodies that recognize the active form of the caspases or the products of caspase cleavage can be used to detect apoptosis within cells. Fluorescently conjugated caspase inhibitors can also be used to label active caspases within cells.
In addition to monitoring caspase activity, many reagents exist for monitoring molecules in the mitochondria that are indicators of apoptosis, such as cytochrome c. Some of the biochemical features of apoptosis such as loss of membrane phospholipid asymmetry and DNA fragmentation can also be used to identify apoptosis. Cell viability assays can be combined with apoptosis assays to provide more information about mechanisms of cell death through multiplexing assays on a single sample. The remainder of this chapter will describe technologies, protocols and tools to allow you to detect apoptosis in a variety of experimental systems.
Detecting Caspase Activity and Activation
Luminescent Assays for Measuring Caspase Activity
The caspase family of cysteine proteases are the central mediators of the proteolytic cascade leading to cell death and elimination of compromised cells. As such, the caspases are tightly regulated both transcriptionally and by endogenous anti-apoptotic polypeptides, which block productive activation (Earnshaw et al. 1999). Furthermore, the enzymes involved in this process dictate distinct pathways and demonstrate specialized functions consistent with their primary biological roles (Stennicke et al. 1999). Assays that directly measure caspase activity can provide valuable information for the researcher about the mechanism of death in dying cells.
The Caspase-Glo® Assays use the luminogenic caspase-8 tetrapeptide substrate (Z-LETD-aminoluciferin), the caspase-9 tetrapeptide substrate (Z-LEHD-aminoluciferin), the caspase-3/7 substrate (Z-DEVD-aminoluciferin), the caspase-6 substrate (Z-VEID-aminoluciferin), or the caspase-2 substrate (Z-VDVAD-aminoluciferin)and a stable luciferase in proprietary buffers. The buffers are optimized for the specific caspase activity, cell lysis and luciferase activity. In the absence of active caspase, the caspase substrates do not act as substrates for luciferase and thus produce no light. Upon cleavage of the substrates by the respective caspase, aminoluciferin is liberated and can contribute to the generation of light in a luminescence reaction (Figure 3.4). The resulting luminescent signal is directly proportional to the amount of caspase activity present in the sample.
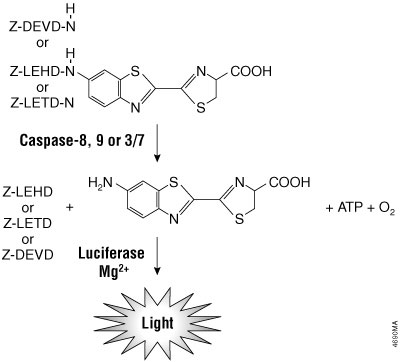
Figure 3.4. Caspase-8, -9, -3/7 cleavage of the proluminogenic substrates containing LETD, LEHD or DEVD, respectively. Following caspase cleavage, a substrate for luciferase (aminoluciferin) is released, resulting in the production of light.
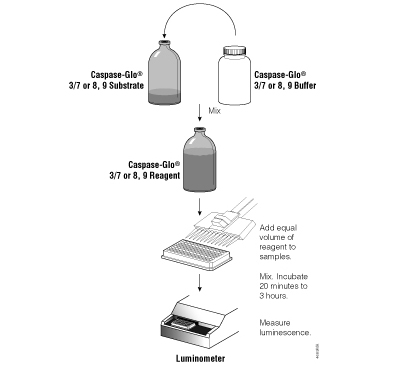
Figure 3.5. Schematic diagram of the Caspase-Glo® Assay protocols.
The Caspase-Glo® 8, 9 and 3/7 Assays are configured for ease of use and are the most sensitive caspase assays available. The reagents are prepared by adding buffer directly to the lyophilized substrate. These homogeneous reagents can then be added to the sample in a convenient 1:1 ratio (Figure 3.5) without a separate lysis step. Because the luminescent signal “glows” rather than “flashes,” reagent injectors are not required, and the assay is suitable for high-throughput applications. Figure 3.6 illustrates the linearity of the Caspase-Glo® 3/7 Assay. For a detailed protocol and more background information on the Caspase-Glo® Assays, please see Technical Bulletins #TB332, #TB333, #TB323, #TB366 or #TB365.
Materials Required:
- Caspase-Glo® 8 Assay and protocol (Cat.# G8200, G8201, G8202), Caspase-Glo® 9 Assay and protocol (Cat.# G8210, G8211, G8212), Caspase-Glo® 3/7 Assay and protocol (Cat.# (G8090, G8091, G8092).
- White-walled multiwell luminometer plates adequate for cell culture
- Multichannel pipettor or automated pipetting station
- Plate shaker, for mixing multiwell plates
- Luminometer capable of reading multiwell plates
- Purified caspase enzyme (e.g., BIOMOL Cat.# SE-172)
- 10mM HEPES buffer (pH 7.4) with 0.1% Prionex® stabilizer to dilute purified enzyme
- Caspase inhibitor, if performing assays to examine caspase inhibition
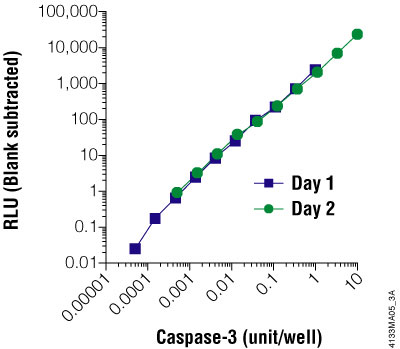
Figure 3.6. The Caspase-Glo® 3/7 Assay is linear over four orders of magnitude of caspase concentration. Purified caspase-3 was titrated and assayed in 96-well plates using the Caspase-Glo® 3/7 Assay on two different days. Luminescence was measured 1 hour after adding the Caspase-Glo® Reagent to the cells. The graph shows that the assay is linear over 4 orders of magnitude of caspase concentration. One unit of caspase = 0.07ng protein = 1pmol of substrate (Ac-DEVD-pNA) hydrolyzed/minute per the manufacturer's unit definition. Each point represents the average of 4 wells. The no-caspase control was subtracted from each point.
Fluorescent Assays for Measuring Caspase Activity
Apo-ONE® Homogeneous Caspase-3/7 Assay
The Apo-ONE® Homogeneous Caspase-3/7 Assay detects caspase-3/7 activity based on the cleavage of a profluorescent DEVD peptide-rhodamine 110 substrate [(Z-DEVD)2-R110]. The Apo-ONE® Reagent is prepared by combining buffer and substrate. The reagent is added directly to culture wells using a 1:1 ratio of reagent to culture medium. The contents are mixed and incubated for 1–2 or more hours, and the fluorescent signal is measured. The reagent permeabilizes the cells to release the caspase, delivers the profluorescent substrate and provides optimized conditions to stabilize caspase activity. Because the fluorescent R110 product continues to accumulate in the presence of active caspase-3 and -7, extending the incubation period up to 18 hours increases the signal-to-background ratio, providing greater sensitivity. The assay is easily scalable to meet miniaturization needs of HTS screening as long as the 1:1 ratio is maintained. Figure 3.7 provides an overview of the assay protocol. For a detailed protocol and background information about this system, please see Technical Bulletin #TB295.
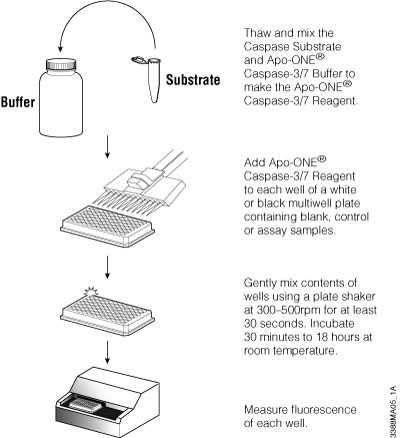
Figure 3.7. Schematic of Apo-ONE® Assay protocol.
Materials Required:
- Apo-ONE® Homogeneous Caspase-3/7 Assay and protocol (Cat.# G7790, G7791, G7792)
- 96- or 384-well opaque white or black plate suitable for cell culture (Nalge Nunc International has FluoroNunc™ Products for such applications)
- fluorescent plate reader (e.g., LabSystems Cat.# 9502887 or equivalent)
- single and multichannel pipettors
- plate shaker
Additional Resources for the Apo-ONE® Homogeneous Caspase-3/7 Assay
Technical Bulletins and Manuals
TB295 Apo-ONE® Homogeneous Caspase-3/7 Assay
Citations
The authors of this study used the Apo-ONE® Assay to assess apoptosis in kidney homogenates.
PubMed Number: 12738801In Situ Marker for Caspase-3: FITC-VAD-FMK
CaspACE™ FITC-VAD-FMK In Situ Marker is a fluorescent analog of the pan caspase inhibitor Z-VAD-FMK (carbobenzoxy-valyl-alanyl-aspartyl-[O-methyl]-fluoromethylketone). The fluorescein isothiocyanate (FITC) group has been substituted for the carbobenzoxy (Z) N-terminal blocking group to create the fluorescent apoptosis marker. This structure allows delivery of the inhibitor into the cell where it irreversibly binds to activated caspases. The FITC label allows for a single-reagent addition to assay for caspase activity in situ. The FITC-VAD-FMK Marker is supplied as a 5mM solution in DMSO and is intended for in situ monitoring of caspase activity by fluorescence detection. The suggested concentration for use in anti-Fas-treated Jurkat cell culture is 10µM.
Method for Detecting Apoptosis in Jurkat Cells
Materials Required:
- CaspACE™ FITC-VAD-FMK In Situ Marker (Cat.# G7461, G7462)
- poly-l-lysine coated slides
- anti-Fas mAb (Clone CH-11 MBL International Cat.# SY-100)
- PBS
- formalin
- mounting medium
- fluorescence microscope
- Seed Jurkat cells at 1 × 10⁵ cells/ml and grow in RPMI-1640 + 10% FBS in a 37°C, 5% CO2 incubator for 2–3 days, until they reach a density of 5 ×10⁵ cells/ml.
- Prepare poly-l-lysine-coated slides. Coat each chamber of multi-chamber slides with 0.01% poly-l-lysine solution. When partially dry, rinse the slides in NANOpure® water and then air-dry. Poly-l-lysine-coated slides can be prepared in advance and stored at 4°C for up to 7 days before use.
- Add anti-Fas mAb (Clone CH-11, MBL International Cat.# SY-100) to a final concentration of 0.1µg/ml. Do not add to controls. Incubate for 3–4 hours at 37°C.
- Add CaspACE™ FITC-VAD-FMK In Situ Marker to the Jurkat cells at a final concentration of 10µM. Protect cells from light and incubate for 20 minutes in the incubator. Keep cells protected from light for the remaining steps.
- Centrifuge at 300 × g for 5 minutes.
- Wash cells with PBS, then centrifuge at 300 × g for 5 minutes.
- Suspend cells in PBS to 1.5 × 10⁶ cells/ml.
- Add cells to poly-l-lysine-coated slides and incubate at room temperature for 5 minutes to allow the cells to adhere to the poly-l-lysine.
- Fix in 10% buffered formalin for 30 minutes at room temperature (protected from light).
- Rinse 3 times for 5 minutes each time in PBS.
- Add mounting medium and coverslips to the slides. Analyze under a fluorescence microscope.
Additional Resources for the CaspACE™ FITC-VAD-FMK In Situ Marker
Technical Bulletins and Manuals
9PIG746 CaspACE™ FITC-VAD-FMK In Situ Marker Product Information
Citations
The CaspACE™ FITC-VAD-FMK In Situ Marker was used at a concentration of 5µM in primary human epidermal keratinocyte culture to visualize active caspases during cell differentiation induced with calcium. In this experiment, the authors cultured primary human epidermal keratinocytes for 48 hours in 1.2mM calcium with or without 100mM z-VAD-FMK to demonstrate specific caspase activation and cell differentiation in calcium-induced keratinocytes upon labeling with the CaspACE™ FITC-VAD-FMK In Situ Marker.
PubMed Number: 12815468Apoptosis in yeast cells was detected using the CaspACE™ FITC-VAD-FMK In Situ Marker. Yeast cells were stained with the marker at room temperature, washed and resuspended. FACS® analysis of cells was performed with excitation at 488nm and emission of 520–550nm.
PubMed Number: 12569108In this article, the CaspACE™ FITC-VAD-FMK In Situ Marker was used to stain tobacco plant cells induced to undergo apoptosis.
PubMed Number: 12058273Detecting Active Caspase-3 Using an Antibody
Anti-ACTIVE® Caspase-3 pAb is intended for use as a marker of apoptosis; it specifically stains apoptotic human cells without staining nonapoptotic cells. All known caspases are synthesized as pro-enzymes activated by proteolytic cleavage. Anti-ACTIVE® Caspase-3 pAb is an affinity-purified rabbit polyclonal antibody directed against a peptide from the p18 fragment of human caspase-3. The antibody is affinity purified using a peptide corresponding to the cleaved region of caspase-3.
General Immunochemical Staining Protocol
Materials Required:
- Anti-ACTIVE® Caspase-3 pAb (Cat.# G7481)
- prepared, fixed samples on slides
- Triton® X-100
- PBS
- blocking buffer (PBS/0.1% Tween® 20 + 5% horse serum)
- donkey anti-rabbit Cy®3 conjugate secondary antibody (Jackson Laboratories Cat.# 711-165-152)
- mounting medium
- humidified chamber
- Permeabilize the fixed cells by incubating in PBS/0.2% Triton® X-100 for 5 minutes at room temperature. Wash three times in PBS, in Coplin jars, for 5 minutes at room temperature.
- Drain the slide and add 200µl of blocking buffer (PBS/0.1% Tween® 20 + 5% horse serum). Use of serum from the host species of the conjugate antibody (or closely related species) is suggested. Lay the slides flat in a humidified chamber and incubate for 2 hours at room temperature. Rinse once in PBS.
- Add 100µl of the Anti-ACTIVE® Caspase-3 pAb diluted 1:250 in blocking buffer. Prepare a slide with no Anti-ACTIVE® Caspase-3 pAb as a negative control. Incubate slides in a humidified chamber overnight at 4°C.
- The following day, wash the slides twice for 10 minutes in PBS, twice for 10 minutes in PBS/0.1% Tween® 20 and twice for 10 minutes in PBS at room temperature.
- Drain slides and add 100µl of donkey anti-rabbit Cy®3 conjugate diluted 1:500 in PBS. (We recommend Jackson Laboratories Cat.# 711-165-152.) Lay the slides flat in a humidified chamber, protected from light, and incubate for 2 hours at room temperature. Wash twice in PBS for 5 minutes, once in PBS/0.1% Tween® 20 for 5 minutes and once in PBS for 5 minutes, protected from light.
- Drain the liquid, mount the slides in a permanent or aqueous mounting medium and observe with a fluorescence microscope.
Additional Resources for the Anti-ACTIVE® Caspase-3 pAb
Technical Bulletins and Manuals
9PIG748 Anti-ACTIVE® Caspase-3 pAb Product Information
Citations
The Anti-ACTIVE® Caspase-3 polyclonal antibody was used to immunohistochemically stain Newcastle Disease Virus (NDV)-infected chicken spleens. Sections were deparaffinized, peroxidase-treated and microwaved for 10 minutes to retrieve antigens. The Anti-ACTIVE® Caspase-3 polyclonal antibody was utilized and detected with a biotinylated anti-rabbit antibody, steptavidin-phosphatase and DAB.
PubMed Number: 12014499Using an Antibody Against a Cleaved Caspase-3 Substrate (Anti-PARP p85 Fragment pAb)
Poly (ADP-ribose) polymerase (PARP), a nuclear enzyme involved in DNA repair, is a well-known substrate for caspase-3 cleavage during apoptosis. Anti-PARP p85 Fragment pAb is a rabbit polyclonal antibody specific for the p85 fragment of PARP that results from caspase cleavage of the 116kDa intact molecule and thus provides an in situ marker for apoptosis. Each batch of antibody is tested for use in immunostaining applications and contains sufficient antibody for 50 immunocytochemical reactions at a working dilution of 1:100.
General Immunocytochemistry Protocol
Materials Required:
- Anti-PARP p85 Fragment pAb (Cat.# G7341)
- cells fixed on slides
- PBS
- blocking buffer (PBS/0.1% Tween® 20 + 5% horse serum)
- donkey anti-rabbit biotin conjugate (Jackson Cat.# 711-065-152) or donkey anti-rabbit Cy®3 conjugate (Jackson Cat.# 711-165-152)
- H2O 2 (if using biotin conjugate)
- DAB solution (if using biotin conjugate)
- ultrapure water
- humidified chamber
- peroxidase-labeled streptavidin (eg., KPL Cat.# 14-300-00, diluted 1µg/ml in PBS)
- Permeabilize cells fixed on slides in 0.2% Triton® X-100/PBS for 5 minutes at room temperature.
- Wash in 1X PBS in coplin jars for 5 minutes at room temperature. Repeat twice for a total of 3 washes.
- Drain the slides and add blocking buffer (PBS/0.1% Tween® 20 + 5% normal serum). Cover cells with blocking buffer (200µl per slide). Lay the slides flat in a humidified chamber and incubate for 2 hours at room temperature.
- Rinse once in PBS.
- Add 100µl of the Anti-PARP p85 Fragment pAb diluted in blocking buffer. We recommend a starting dilution of 1:100. Include a slide with no Anti-PARP p85 Fragment pAb as a negative control. Incubate slides in a humidified chamber overnight at 4°C.
- The following day, wash the slides twice for 10 minutes in 1X PBS, twice for 10 minutes in PBS/0.1% Tween® 20, and twice for 10 minutes in 1X PBS at room temperature.
- If the secondary antibody is a horseradish peroxidase (HRP) conjugate, block endogenous peroxidases by incubating with 0.3% hydrogen peroxide for 4–5 minutes at room temperature. If you are using a different method of detection with a secondary antibody, proceed to Step 9.
- Wash in 1X PBS in coplin jars for 5 minutes. Repeat twice for a total of 3 washes.
- Drain slides and add 100–200µl of diluted secondary antibody to each slide. We recommend donkey anti-rabbit biotin conjugate (Jackson Cat.# 711-065-152) or donkey anti-rabbit Cy®3 conjugate (Jackson Cat.# 711-165-152) diluted 1:500 in PBS/0.1% Tween® 20. Lay the slides flat in a humidified chamber and incubate for 2 hours at room temperature.
- Wash several times in 1X PBS.
- For the biotin conjugate, drain the slides and add 100–200μl of Streptavidin-HRP solution to each slide. Lay the slides flat in a humidified chamber and incubate for 45 minutes at room temperature. For HRP-conjugated secondary antibodies, proceed to Step 13. For other secondary antibodies, proceed to Step 15.
- Wash in 1X PBS in coplin jars for 5 minutes. Repeat twice for a total of 3 washes.
- Add 100–200μl of freshly made diaminobenzidine (DAB) solution to each slide. Lay the slides flat and incubate for ~10 minutes at room temperature.
- Rinse the slides in NANOpure® water. Bleach is frequently used to inactivate the DAB before disposal; however, local requirements for hazardous waste should be followed.
- Drain the liquid and mount the slides in a permanent or aqueous mounting medium (slides mounted in 70% glycerol can be stored for several weeks at 4°C or –20°C).
Method for Staining Postnatal Day 0 Mouse Brain, Paraffin-Embedded Sections. (All steps are performed at room temperature.)
Materials Required:
- Anti-PARP p85 Fragment, pAb (Cat.# G7341)
- paraffin-embedded, fixed sample
- HemoDe® (Fisher Scientific) or xylene
- ethanol (100, 95 and 70%)
- PBS
- Triton® X-100
- H2O2
- biotin-conjugated donkey anti-rabbit pAb
- RTU ABC reagent (Vector Laboratories)
- DAB substrate kit (Vector Laboratories)
- VECTASHIELD® DAPI anti-fade Reagent (Vector Laboratories)
- Embed tissue in paraffin after fixation in 4% paraformaldehyde. Six micron sections are used for this protocol.
Note: Best results will be obtained if the animal is perfused with fix and postfixed after dissection.
- Deparaffinize by washing tissue 3 times for 5 minutes each in Hemo De® (Fisher Scientific) or xylene. Rinse tissue sections for 2 minutes in 100% ethanol. Transfer sections to 95% ethanol for 2 minutes, then transfer them to 70% ethanol for 2 minutes. Finally, rinse tissue sections 2 times for 2 minutes each in PBS.
- Permeabilize for 10 minutes in PBS + 0.1% Triton® X-100.
- Wash sections 2 times for 5 minutes each in PBS.
- Block endogenous peroxide activity by incubating sections in 0.3% H2O2 in PBS for 30 minutes.
- Wash sections 2 times for 5 minutes each in PBS.
- Block for 45 minutes in PBS + 5% donkey serum
- Incubate with Anti-PARP p85 Fragment pAb diluted 1:50 in PBS + 1.0 % donkey serum for 60 minutes.
- Wash sections 3 times for 5 minutes each in PBS.
- Incubate with biotin-conjugated donkey anti-rabbit pAb (Jackson Laboratories) diluted 1:500 in PBS for 60 minutes.
- Wash sections 3 times for 5 minutes each in PBS.
- Incubate in RTU (Ready To Use) ABC reagent (Vector Laboratories) for 60 minutes.
- Wash sections 3 times for 5 minutes each in PBS.
- Develop with DAB substrate kit (Vector Laboratories) for 10 minutes.
- Wash 3 times for 5 minutes each in water.
- Mount in VECTASHIELD® + DAPI anti-fade reagent (Vector Laboratories).
- Analyze samples immediately using a fluorescence microscope.
Additional Resources for the Anti-PARP p85 Fragment pAb
Technical Bulletins and Manuals
TB273 Anti-PARP p85 Fragment pAb Technical Bulletin
Citations
Anti-PARP p85 Fragment pAb was used to stain human peritoneal and pleural effusions.
PubMed Number: 12796393The authors demonstrate specificity of an affinity-purified polyclonal antibody to the p85 fragment of PARP with Western blots that show that the antibody recognizes the 85kDa (p85) fragment of PARP but not full-length PARP.
PubMed Number: 11314271Detecting Cell Death Using Mitochondrial Markers
Detecting Cell Death with Mitochondrial Dyes
Although early stages of apoptosis do not result in immediate changes in mitochondrial metabolic activity, during apoptosis the electrochemical gradient across the mitochondrial outer membrane (MOM) collapses. One theory suggests that the change in the electrochemical gradient results from the formation of pores in the MOM by the activation and assembly of Bcl-2 family proteins in the mitochondria. One common method for observing the change in MOM properties involves a fluorescent cationic dye. In healthy nonapoptotic cells, the lipophilic dye accumulates in the mitochondria. Once the molecules reach a critical concentration inside the mitochondria, they form aggregates that emit a specific fluorescence (bright red for the cationic dye, JC-1). But, in apoptotic cells, the MOM does not maintain the electrochemical gradient, and the cationic dye diffuses into the cytoplasm, where the monomeric form emits a specific fluorescence that is different from the fluorescence of the aggregated form (green for the cationic dye, JC-1; Zamazami et al. 2000).
Other mitochondrial dyes can be used to measure the redox potential or metabolic activity of the mitochondria in the cells. Late in cell death processes, mitochondria lose their ability to metabolize such dyes. Although mitochondrial dyes can provide information about the overall “health” of the cells, they cannot specifically address the mechanism of cell death (apoptosis or necrosis) and are usually used in conjunction with other apoptosis detection methods (such as a caspase assay) to determine the mechanism of cell death (Zamzami et al. 2000; Waterhouse et al. 2003).
Detecting Apoptosis by Measuring Changes in the Cell Membrane
Normally, eukaryotic cells maintain a specific asymmetry of phospholipids in the inner and outer leaflets of the cell membrane. During cell death phosphatidylserine (PS) becomes abundant on the outer leaflet. Detecting this change in phospholipid asymmetry is one way to detect cell death. Annexin V is a phospholipid binding protein that has a high affinity for PS. Normally, Annexin V does not bind to intact cells; however, if a cell is dying, Annexin V will bind to the PS in the outer leaflet of the cell membrane. If Annexin V is conjugated to a dye or fluorescent molecule, it can be used to label apoptotic cells (van Genderen et al. 2003; Bossy-Wetzel and Green, 2000).
Using DNA Fragmentation to Detect Apoptosis
Many of the assays used to detect apoptosis analyze the characteristic DNA fragmentation that occurs during apoptosis. In apoptotic cells the genomic DNA is cleaved to multimers of 180–200bp (based on the nucleosomal repeat length). This cleaved DNA is easily observed as a “ladder” upon analysis by gel electrophoresis. To detect this DNA fragmentation at the single-cell level, assays rely on labeling the ends of the nucleosomal fragments followed by either colorimetric or fluorescent detection. The DeadEnd™ Assays use this approach, commonly called the TUNEL (TdT-mediated dUTP Nick End Labeling) assay. With this system cells are treated so that the membrane is permeable to the reagents and enzymes necessary to label the DNA fragments. After cellular uptake of the reagents, the 3′ OH ends of the multimers are “tailed” with labeled fluorescein-12-dUTP (DeadEnd™ Fluorometric TUNEL System) or with biotinylated nucleotides (DeadEnd™ Colorimetric TUNEL System). For the fluorometric assay, the fragments produced are fluorescently labeled. For the colorimetric assay, the biotinylated DNA fragments are detected using streptavidin-conjugated horseradish peroxidase.
DeadEnd™ Fluorometric TUNEL System
Materials Required:
- DeadEnd™ Fluorometric TUNEL System (Cat.# G3250)
- PBS
- propidium iodide (Sigma Cat.# P4170)
- optional: SlowFade ® Light Anti-Fade Kit (Molecular Probes Cat.# S7461) or VECTASHIELD® (Vector Labs Cat.# H-1000)
- optional: VECTASHIELD® + DAPI (Vector Labs Cat.# H-1200)
For Cultured Cells
Materials Required:
- 1% methanol-free formaldehyde (Polysciences Cat.# 18814) in PBS
- 4% methanol-free formaldehyde (Polysciences Cat.# 18814) in PBS
- 70% ethanol
- 0.2% Triton® X-100 solution in PBS
- 0.1% Triton® X-100 solution in PBS containing 5mg/ml BSA
- DNase I (e.g., RQ1 RNase-Free DNase, Cat.# M6101)
- 20mM EDTA (pH 8.0)
- DNase buffer
- DNase-free RNase A
For Paraffin-Embedded Tissue Sections
Materials Required:
- 4% methanol-free formaldehyde (Polysciences Cat.# 18814) in PBS
- xylene
- ethanol (100%, 95%, 85%, 70% and 50% diluted in deionized water)
- 0.85% NaCl solution
- proteinase K buffer
- DNase I
- DNase I buffer
Equipment for Cultured Adherent Cells and Tissue Sections
Materials Required:
- poly-l-lysine-coated or silanized microscope slides
- cell scraper
- Coplin jars (separate jar needed for optional DNase I positive control)
- forceps
- humidified chambers for microscope slides
- 37°C incubator
- micropipettors
- glass coverslips
- rubber cement or clear nail polish
- fluorescence microscope
Equipment for Cell Suspensions
Materials Required:
- tabletop centrifuge
- 37°C incubator or a 37°C covered water bath
- poly-l-lysine-coated or silanized microscope slides
- Coplin jars (separate jar needed for optional DNase I positive control)
- forceps
- glass coverslips
- humidified chambers for microscope slides
- micropipettors
- flow cytometer or fluorescence microscope
Apoptosis Detection by Fluorescence Microscopy (protocol)
- Attach cells to slides and fix in methanol-free formaldehyde solution.
- Wash slides in PBS then permeabilize with Triton® X-100.
- Rinse slides in PBS and tap dry. Pre-equilibrate slides with Equilibration Buffer (5–10 minutes at room temperature).
- Thaw nucleotide mix and prepare the rTdT incubation buffer for reactions and controls as described in Technical Bulletin #TB235.
- Label DNA strand breaks with fluorescein-12-dUTP for 60 minutes at 37°C in a humidified chamber protected from light.
- Stop reactions by immersing slides in 2X SSC (15 minutes at room temperature).
- Wash the slides 3 times for 5 minutes each in PBS to remove unincorporated fluorescein-12-dUTP.
- Stain the samples in a Coplin jar by immersing the slides in 40ml of propidium iodide solution freshly diluted to 1µg/µl in PBS for 15 minutes at room temperature in the dark.
- Wash the slides 3 times for 5 minutes each in PBS.
- Analyze samples immediately using a fluorescence microscope. Alternatively, add 1 drop of Anti-Fade solution (Molecular Probes Cat.# S7461) to the area containing the treated cells and mount slides using glass coverslips. Seal the edges with rubber cement or clear nail polish and let dry for 5–10 minutes.
Analysis of Suspension Cells By Flow Cytometry (protocol overview)
- Wash 3–5 × 10⁶ cells with PBS and centrifuge at 300 × g at 4°C. Repeat this wash and resuspend in 0.5ml of PBS.
- Fix the cells by adding 5ml of 1% methanol-free formaldehyde for 20 minutes or overnight on ice.
- Centrifuge the cells at 300 × g for 10 minutes at 4°C, remove the supernatant and resuspend cells in 5ml of PBS. Repeat wash once and resuspend cells in 0.5ml of PBS.
- Add the cell suspension to 5ml of 70% ice-cold ethanol and keep at –20°C for at least 4 hours.
- Centrifuge the cells at 300 × g for 10 minutes and resuspend in 5ml of PBS. Repeat centrifugation and resuspend the cells in 1ml of PBS.
- Transfer 2 × 10⁶ cells into a 1.5ml microcentrifuge tube.
- Centrifuge at 300 × g for 10 minutes, remove supernatant and resuspend the pellet in 80μl of Equilibration Buffer. Incubate at room temperature for 5 minutes.
- While the cells are equilibrating, thaw the Nucleotide Mix on ice and prepare sufficient rTdT incubation buffer for all reactions according to Technical Bulletin #TB235. To determine the total volume of rTdT incubation buffer needed, multiply the number of reactions times 50μl, the volume of a standard reaction using 2 × 10⁶ cells.
For negative controls, prepare a control incubation buffer without rTdT Enzyme, substituting deionized water for the enzyme.
- Centrifuge cells at 300 × g for 10 minutes. Remove supernatant and resuspend the pellet in 50μl rTdT incubation buffer. Incubate in a water bath for 60 minutes at 37°C, protecting from direct light exposure. Resuspend the cells by pipetting at 15-minute intervals.
- Terminate the reaction by adding 1ml of 20mM EDTA. Vortex gently.
- Centrifuge cells at 300 × g for 10 minutes. Remove supernatant and resuspend the pellet in 1ml of 0.1% Triton® X-100 solution in PBS containing 5mg/ml BSA. Repeat once for a total of 2 rinses.
- Centrifuge cells at 300 × g for 10 minutes. Remove supernatant and resuspend the cell pellet in 0.5ml propidium iodide solution (freshly diluted to 5μg/ml in PBS) containing 250μg of DNase-free RNase A.
- Incubate the cells at room temperature for 30 minutes in the dark.
- Analyze cells by flow cytometry. Measure green fluorescence of fluorescein-12-dUTP at 520±20nm and red fluorescence of propidium iodide at >620nm.
Additional Resources for the DeadEnd™ Fluorometric TUNEL System
Technical Bulletins and Manuals
TB235 DeadEnd™ Fluorometric TUNEL System Technical Bulletin
Citations
The DeadEnd™ Fluorometric TUNEL System was used to demonstrate the apoptotic effect of secreted phospholipase A2 (sPLA2) on primary rat cortical neurons in culture. Dual staining with the DeadEnd™ Fluorometric TUNEL System and propidium iodide allowed quantification of the TUNEL staining area by analysis of digitized images.
PubMed Number: 14519523The authors developed an automated, laser scanning, cytometer-based method to quantify the percentage of tumor cells containing DNA fragmentation characteristic of apoptosis. They used the DeadEnd™ Fluorometric TUNEL System to analyze sections from breast tumor biopsies.
PubMed Number: 12631592DeadEnd™ Colorimetric TUNEL System
Materials Required:
- DeadEnd™ Colorimetric TUNEL System (Cat.# G7360, G7130)
- phosphate-buffered saline (PBS)
- 0.3% hydrogen peroxide for blocking endogeneous peroxidases
- fixative (e.g., 10% buffered formalin, 4% paraformaldehyde, 4% methanol-free formaldehyde)
- mounting medium
For Cultured Cells
Materials Required:
- poly-l-lysine
- 0.2% Triton® X-100 solution in PBS
- DNase I (e.g., RQ1 RNase-Free DNase, Cat.# M6101)
- DNase buffer
For Paraffin-Embedded Tissue Sections
Materials Required:
- xylene or xylene substitute [e.g., Hemo-De® Clearing Agent (Fisher Cat.# 15-182-507A)]
- ethanol (100%, 95%, 85%, 70% and 50%) diluted in deionized water
- 0.85% NaCl solution
- proteinase K buffer
- DNase I
- DNase I buffer
Equipment for Tissue Sections and Cultured Cells
Materials Required:
- poly-l-lysine-coated or silanized microscope slides
- forceps
- Coplin jars (separate jar needed for optional DNase I positive control)
- humidified chambers for microscope slides
- 37°C incubator
- micropipettors
- glass coverslips
- clear nail polish or rubber cement
- microscope
Apoptosis Detection (protocol)
- Prepare samples by attaching sections or cells to a microscope slide, fixing the sample, washing and permeabilizing the cells with 0.2% Triton® X-100 in PBS.
- Pre-equilibrate the slides with Equilibration Buffer.
- Label DNA strand breaks with Biotinylated Nucleotide Mix (60 minutes at 37°C).
- Stop the reaction by immersing slides in 2X SSC (15 minutes at room temperature).
- Wash the slides 3 times for 5 minutes each in PBS.
- Block with hydrogen peroxide (3–5 minutes at room temperature).
- Wash the slides 3 times for 5 minutes each in PBS.
- Add Streptavidin HRP diluted in PBS (30 minutes at room temperature).
- Wash the slides 3 times for 5 minutes each in PBS.
- Add DAB and develop (approximately 10 minutes).
- Rinse slides several times in deionized water and analyze sample with a light microscope.
Additional Resources for the DeadEnd™ Colorimetric TUNEL System
Technical Bulletins and Manuals
TB199 DeadEnd™ Colorimetric TUNEL System Technical Bulletin
Citations
Apoptotic cells were detected in paraffin-embedded sections of mouse lung tissue with the DeadEnd™ Colorimetric TUNEL System
PubMed Number: 11935029The apoptotic nature of neuron cell death via a chemokine-activated cell-cell communication system involving microglia was characterized. Hippocampal pyramidal neurons were obtained from embryonic day 17 rat brain and exposed to gp120IIIB and stained for neuronal death by apoptosis using the DeadEnd™ Colorimetric TUNEL System. Neuronal death was also detected by immunocytochemistry using the Anti-ACTIVE® Caspase-3 pAb (1:250 dilution).
PubMed Number: 11426226Using Two or More Detection Methods to Confirm Apoptosis
Typically, more than one method is necessary to confirm that cell death is occurring via apoptosis. Cultured cells undergoing apoptosis in vitro eventually undergo secondary necrosis. After extended incubation, apoptotic cells ultimately shut down metabolism, lose membrane integrity and release their cytoplasmic contents into the culture medium. Markers of apoptosis such as caspase activity may be expressed only transiently. Therefore, to determine if apoptosis is the primary mechanism of cell death, understanding the kinetics of the cell death process in your model system is critical. If detailed information on the mechanism of cell death is desired, the duration of exposure to the toxin, the concentration of the test compound and the choice of assay endpoint become critical.
Multiplexing Assays
The ability to gather more than one set of data from the same sample (i.e., multiplexing) is becoming increasingly important. Multiplexing more than one assay from the same culture well can provide internal controls and eliminate the need to repeat work. Figure 3.9 shows data obtained from multiplexing a luminescent caspase-8 and a fluorescent caspase-3/7 assay. Figure 3.10 shows an example of multiplexing a cell viability assay (CellTiter-Blue® Assay) and a caspase assay (Apo-ONE® Assay) sequentially in the same well. Below we provide several sample protocols for multiplexing Promega cell-based viability, cytotoxicity and apoptosis assays. These protocols are intended as staring points. As with any homogeneous assay, multiplexing assays will require optimization for each experimental system. We strongly recommend running appropriate controls, including performing each assay individually on the samples. Additional background, optimization and recommended controls for each assay are provided in the technical literature that accompanies each individual assay. We strongly advise reading this information before attempting a multiplexing experiment.
Distinguishing Caspase-3/7 and Caspase-8 or -9 Activity (Sample Protocol)
Materials Required:
- Caspase-Glo® 8 or 9 Reagent (Cat.# G8200, G8201, G8202 or Cat.# G8210, G8211, G8212
- Apo-ONE® Homogeneous Caspase-3/7 Assay (Cat.# G7790, G7791, G7792)
- plate-reading luminometer
- fluorescent plate reader
- Culture and treat cells with drug of interest in 100µl of medium in a 96-well plate.
Note: It is often beneficial to identify and include control compounds that induce specific caspase response profiles (e.g., TNF-superfamily ligands or agonists for extrinsic pathway or small molecule inducers or insults for intrinsic pathway). In addition, a vehicle control should always be included to matched wells at the same time as any test compound.
- During the cell exposure to the compounds, prepare either the Caspase-Glo® 8 or 9 reagents by adding the Caspase-Glo® Buffer to the lyophilized Substrate.
- Thaw the Apo-ONE® substrate and add it to either the Caspase-Glo® 8 or 9 reagent at a dilution of 1:200 50μl/10ml of Caspase-Glo® 8 or 9 reagent). The Apo-ONE® buffer will not be used in this multiplexed assay. Shield the multiplexing reagent from ambient light and allow it to equilibrate to room temperature.
- Remove plated cells from the incubator (37°C) and add an equal volume of the multiplexing reagent (e.g., 100μl to 100μl).
- Mix briefly at 500–700rpm on an orbital shaker and shield them from ambient light.
Note: Mixing by pipetting is discouraged, because it may create excess bubbles.
- Incubate for 30 minutes to 1 hour at room temperature to achieve steady-state signal associated with the Caspase-Glo® 8 or 9 Assays. Measure luminescence.
- Read fluorescence signal at 485Ex/525Em.
Note: Fluorescence intensity of the caspase-3/7 assay will increase as a function of time. Therefore, the fluorescence signal will likely be greater after a 2– to 3-hour incubation. Although the luminescent Caspase-Glo® 8 or 9 Assays have stable luminescence profiles with a half-life approaching 5 hours, measurements should be taken within 3 hours.
Other Considerations: Caspases-8 and -9 are initiator enzymes which activate the effector caspases-3 or -7. To this end, the kinetics of the useable induction windows of the multiplexed assay differ somewhat. Although, maximal caspase-8 or -9 activities mirror those of caspase-3 or -7, the activity half-lifes differ in a manner consistent with their biological function. In other words, caspase-3 or -7 may be measurable much longer than the more transient caspase-8 or -9 activities. The optimal response should be determined by time course studies.
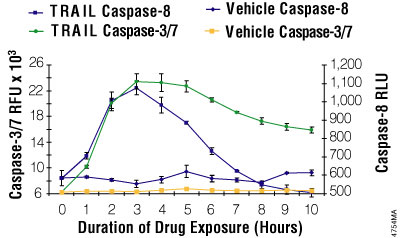
Figure 3.8. Multiplexing luminescent caspase-8 and fluorescent caspase-3/7 assays. Jurkat cells were seeded at 25,000 cells/well. Fifty microliters of rTRAIL (Chemicon, 100ng/ml final) or a vehicle control (RPMI 1640 with 10% FBS) was added to replicate wells every hour for 10 hours. Caspase-Glo® 8 reagent was prepared by combining the assay buffer with the substrate. The fluorescent Apo-ONE® Assay caspase-3/7 substrate was mixed into the Caspase-Glo® 8 reagent at a final concentration of 50μM. The combined reagent/substrate was added in 100μl volumes, incubated 60 minutes, and then luminescence and fluorescence were measured.
Multiplexing a Fluorescent Caspase-3/7 Assay with a Cell Viability Assay (Sample Protocol)
Materials Required:
- CellTiter-Blue® Cell Viability Assay (Cat.# G8080, G8081, G8082)
- Apo-ONE® Homogeneous Caspase-3/7 Assay (Cat.# G7790, G7791, G7792)
- fluorescent plate reader
- Culture and treat cells with drug of interest in 100µl of medium in a 96-well plate. During the final 1–2 hours of treatment, add 20μl/well of CellTiter-Blue® Reagent directly to the culture wells.
- Return plate to incubator for duration of the treatment period.
- Record CellTiter-Blue® fluorescence (viability) at 560nm/590nm.
- Add an equal volume of Apo-ONE® Reagent (120μl/well).
- Record Apo-ONE® fluorescence (caspase) at 485Ex/527Em.
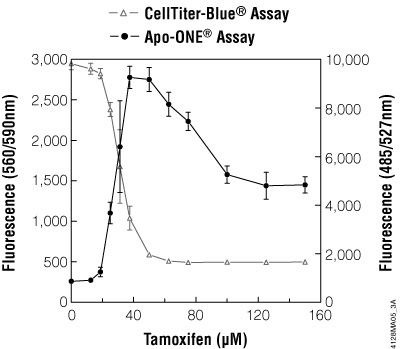
Figure 3.9. Multiplexing cell viability assays. HepG2 cells (10,000 cells/100μl cultured overnight) were treated with various concentrations of tamoxifen for 5 hours. Viability was determined by adding CellTiter-Blue® Reagent (20μl/well) to each well after 3.5 hours of drug treatment and incubating for 1 hour before recording fluorescence (560Ex/590Em). Caspase activity was then determined by adding 120μl/well of Apo-ONE® Reagent and incubating for 0.5 hour before recording fluorescence (485Ex/527Em).
Multiplexing a Luminescent Caspase Assay with a Fluorescent Cell Viability Assay (Sample Protocol)
Materials Required:
- CellTiter-Blue® Cell Viability Assay (Cat.# G8080, G8081, G8082 )
- Caspase-Glo® 3/7 Assay (Cat.# G8090, G8091, G8092)
- fluorescent plate reader
- plate-reading luminometer
- Culture and treat cells with drug of interest in 100μl of medium in a 96-well plate.
- During the final 1–2 hours of treatment, add 20μl/well CellTiter-Blue® Reagent using diluted 1:4 with Dulbecco's PBS.
- Return the plate to the incubator for the duration of the treatment period.
- Record the CellTiter-Blue® fluorescence (viability) at 560Ex/590Em.
- Add an equal volume of Caspase-Glo® 3/7 Reagent (120μl/well). The wells will slowly turn bright pink.
- Incubate one hour at room temperature and record luminescence (caspase activity).
Determine the Mechanism of Cytotoxicity (Sample Protocol)
Materials Required:
- CytoTox-ONE™ Homogeneous Membrane Integrity Assay (2X concentration; Cat.# G7890, G7891)
- Caspase-Glo® 3/7 Assay (Cat.# G8090, G8091, G8092)
- fluorescent plate reader
- plate-reading luminometer
- Culture and treat cells with the drug of interest in 100µl of medium in a 96-well plate.
- Reconstitute CytoTox-ONE™ Substrate at 2X concentration and add 25μl/well.
- Shake while incubating for 10 minutes at room temperature. Record fluorescence (560Ex /590Em) as described in the CytoTox-ONE™ System Technical Bulletin #TB306.
- Add an equal volume (125μl) of Caspase-Glo® 3/7 Reagent to each well.
- Incubate for 1 hour at room temperature to achieve luminescence steady state. Record luminescence as described in the Caspase-Glo® 3/7 Assay Technical Bulletin #TB323.
Assessing Gene Regulation and Apoptosis Involvement (Sample Protocol)
Materials Required:
- EnduRenμ Live Cell Substrate (Cat.# E6481, E6482, E6485)
- Apo-ONE® Homogeneous Caspase-3/7 Assay Reagent (Cat.# G7790, G7791, G7792)
- cells transfected with appropriate Renilla luciferase reporter
- plate-reading luminometer
- fluorescent plate reader
- Culture and treat cells with drug of interest in 90µl of medium in a 96-well plate.
- Add EnduRen™ Substrate (60μM final 10μl/well) to a portion of the wells containing drug treated cells and incubate for an additional 2 hours 37°C, 5% CO2. You may add the Substrate before or after experimental treatment, depending on cell tolerance to the EnduRen™ Substrate.
- Record luminescence.
- Add an equal volume of Apo-ONE® Reagent (100µl/well) and incubate for 1 hour at room temperature.
- Record fluorescence (485Ex/527Em).as described in Technical Bulletin TB295.
Note: We strongly recommend the following controls: Drug-treated cells with Apo-ONE® Reagent added alone and drug-treated cells with EnduRen™ Substrate added alone.
General Protocols for Inducing Apoptosis in Cells
Apoptosis may be induced in experimental systems through a variety of methods, including:
Treating cells with the protein synthesis inhibitor, anisomycin, or the DNA topoisomerase I inhibitor, camptothecin, induces apoptosis in the human promyelocytic cell line HL-60 (Del Bino et al. 1991; Li et al. 1995; Gorczyca et al. 1993; Darzynkiewicz et al. 1992).
Withdrawal of growth factors induces apoptosis of growth factor-dependent cell lines. For example, NGF-deprivation of PC12 cells or sympathetic neurons in culture induces apoptosis (Batistatou and Greene, 1991).
In vitro treatment with the glucocorticoid, dexamethasone, induces apoptosis in mouse thymus lymphocytes (Gavrieli et al. 1992; Cohen and Duke 1984).
Activation of either Fas or TNF-receptors by the respective ligands or by cross-linking with agonist antibody induces apoptosis of Fas- or TNF receptor-bearing cells (Tewari and Dixit 1995).
Anti-Fas mAb Induction of Apoptosis in Jurkat Cells
- Grow Jurkat cells in RPMI-1640 medium containing 10% fetal bovine serum in a humidified, 5% CO2 incubator at 37°C.
- Suspend the cells in fresh medium at a concentration of 1 × 10⁵ cells/ml. After two to three days of incubation in a 37°C, 5% CO2 incubator, harvest the cells by centrifugation at 300–350 × g for 5 minutes.
- Resuspend cells in fresh medium to 5 × 10⁵ cells/ml and add anti-Fas mAb to a final concentration of 0.05–0.1µg/ml. Incubate for 3–6 hours in a 37°C incubator. As a negative control, incubate untreated cells (no anti-Fas mAb) under the same conditions. (Stop here for homogeneous assay, or plate the cells in a 96-well plate.)
- Harvest the cells by centrifugation at 300–350 × g for 5 minutes.
- Remove all medium and resuspend cells in PBS.
- Repeat centrifugation and resuspend the cell pellet in PBS to 1.5 × 10⁶ cells/ml.
Anisomycin-Induced Apoptosis in HL-60 Cells
Treatment with the protein synthesis inhibitor, anisomycin induces apoptosis in the human promyelocytic cell line HL-60.
- Grow HL-60 cells in RPMI-1640 medium containing 10% fetal bovine serum in a humidified 5% CO2 incubator at 37°C.
- Adjust the cell density to 5 × 10⁵ cells/ml and treat with anisomycin at a final concentration of 2μg/ml (dissolved in DMSO). Incubate for 2 hours in a humidified 5% CO2 incubator at 37°C. Treat negative control cells with an equal volume of DMSO, and incubate under the same conditions.
- Harvest the cells and resuspend in PBS to 1.5 x 10⁶/ml.
Staurosporine-Induced Apoptosis in SH-SY5Y Neuroblastoma Cells
- Culture cells in a 1:1 mixture of Ham’s F12 nutrients and minimal essential medium supplemented with 10% fetal bovine serum (FBS), 100IU/ml penicillin and 100mg/ml streptomycin in an atmosphere of 95% air and 5% CO2 at 37°C.
- Allow cells to reach 70% confluence. Trypsinize to release cells from the flask, and plate in a 96-well plate in 45% MEM, 45% F12K and 10% FBS.
- After 24 hours, treat cells with 100μl of 3.125µM staurosporine in DMSO.
- Incubate with staurosporine for 24 hours before performing cell-based assay.
References
- Batistatou, A. and Greene, L.A. (1991) Aurintricarboxylic acid rescues PC12 cells and sympathetic neurons from cell death caused by nerve growth factor deprivation: Correlation with suppression of endonuclease activity. J. Cell Biol. 115, 461–71.
- Boatright, K.M. et al. (2003) A unified model for apical caspase activation. Molecular Cell 11, 529–41.
- Bossy-Wetzel, E. and Green, D.R. (2000) Detection of apoptosis: Annexin V labeling. In: Meth. Enzymol. Reed, J.C. ed. 332, 15–18.
- Chan, F.K. et al. (2000) A domain in TNF receptors that mediates ligand-independent receptor assembly and signaling. Science 288, 2351–54.
- Cohen, J.J. and Duke, R.C. (1984) Glucocorticoid activation of a calcium-dependent endonuclease in thymocyte nuclei leads to cell death. J. Immunol. 132, 38–42.
- Cotter, T.G. and Curtin, J.F. (2003) Historical perspectives. In: Essays in Biochemistry. Cotter, T.G. et al. eds. 39, 1–10.
- Csiszar, A. et al. (2004) Proinflammatory phenotype of coronary arteries promotes endothelial apoptosis in ageing. Physiol. Genomics 17, 21–30.
- Daniel, P.T. et al. (2003) Guardians of cell death: The Bcl-2 family proteins. In: Essays in Biochemistry. Cotter, T.G. et al. eds. 39, 73–88.
- Darzynkiewicz, Z. et al. (1992) Features of apoptotic cells product by flow cytometry. Cytometry 13, 795–808.
- Del Bino, G. et al. (1991) The concentration-dependent diversity of effects of DNA topoisomerase I and II inhibitors on the cell cycle of HL-60 cells. Exp. Cell Res. 195, 485–91.
- Earnshaw, W. et al. (1999) Mammalian caspases: Structure, activation, substrates, and functions during apoptosis. Annu. Rev. Biochem. 68, 383–424.
- Ellis, H.M. and Horvitz, H.R. (1986) Genetic control of programmed cell death in the nematode C. elegans. Cell 44, 817–29.
- Gavrieli, Y. et al. (1992) Identification of programmed cell death in situ via specific labeling of nuclear DNA fragmentation. J. Cell Biol. 119, 493–501.
- Gorczyca, W. et al. (1993) The cell cycle related differences in susceptibility of HL-60 cells to apoptosis induced by various antitumor agents. Cancer Res. 53, 3186–92.
- Hayakawa, Y. et al. (2003) Inhibition of cardiac myocyte apoptosis improves cardiac function and abolishes mortality in peripartum cardiomyopathy of Galpha(q) transgenic mice. Circulation 108, 3036–41.
- Hedgecock, E.M., et al. (1983) Mutations affecting programmed cell deaths in the nematode Caenorhabditis elegans. Science 220, 1277–9.
- Hengartner, M.O. (1997) Programmed Cell Death. In: C. elegans II. Riddle, D.L. et al. eds. 383–496. (Cold Spring Harbor Laboratory Press, Plainview, N.Y.)
- Hengartner, M.O. (2000) The biochemistry of apoptosis. Nature 407, 770–6.
- Hengartner, M.O., et al. (1992) C. elegans cell survival gene ced-9 protects cells from programmed cell death. Nature 356, 494–9.
- Hengartner, M.O. and Horvitz, R.W. (1994) C. elegans cell survival gene ced-9 encodes a functional homolog of the mammalian proto-oncogene bcl-2. Cell 76, 665–76.
- Hitomi, J. et al. (2004a) Involvement of caspase-4 in endoplasmic reticulum stress-induced apoptosis and Aβ-induced cell death. J. Cell Biol. 165, 347–56.
- Hitomi, J. et al. (2004b) Apoptosis induced by endoplasmic reticulum stress depends on activation of caspase-3 via caspase-12. Neurosci. Lett. 357, 127–30.
- Kerr, J.F.R., et al. (1972) Apoptosis: A basic biological phenomenon with wide-ranging implications in tissue kinetics. Br. J. Cancer 26, 239–57.
- Leist, M. and Jäättelä, M. (2001) Four deaths and a funeral: From caspases to alternative mechanisms. Nat. Rev. Mol. Cell Biol. 2, 589–98.
- Li, X. et al. (1995) Single-step procedure for labeling DNA strand breaks with fluorescein- or BODIPY-conjugated deoxynucleotides: Detection of apoptosis and bromodeoxyuridine incorporation. Cytometry. 20, 172–80.
- Murphy, F.J., Serry, L.T. and Hayes, I. (2003) Therapeutic approaches to the modulation of apoptosis. In: Essays in Biochemistry. Cotter, T. et al. eds. 39, 131–53. (Cold Spring Harbor Laboratory Press, Plainview, N.Y.)
- Nakagawa, T. et al. (2000) Caspase-12 mediates endoplasmic reticulum-specific apoptosis and cytotoxicity by amyloid beta. Nature 403, 98–103.
- Nicholson, D.W. (2000) From bench to clinic with apoptosis-based therapeutic agents. Nature 407, 810–6.
- Parone, P. et al. (2003) Apoptosis: Bombarding the mitochondria. In: Essays in Biochemistry. Cotter, T. et al. eds. 39, 41–51. (Cold Spring Harbor Laboratory Press, Plainview, N.Y.)
- Rao, R.V. et al. (2001) Coupling endoplasmic reticulum stress to the cell death program mechanism of cell death activation. J. Biol. Chem. 276, 33869–74.
- Reed, J.C. (2002) Apoptosis-based therapies. Nat. Rev. Drug Discov. 1, 111–21.
- Rich, T., Watson, C.J. and Wyllie, A. (1999) Apoptosis: The germs of death. Nat.Cell Biol. 1, E69–E71.
- Riss, T.L. and Moravec, R.L. (2004) Use of multiple assay endpoints to investigate the effects of incubation time, dose of toxin, and plating density in cell-based cytotoxicity assays. Assay and Drug Dev.Technol. 2, 51–62.
- Siegel, R.M. et al. (2000) Fas preassociation required for apoptosis signaling and dominant inhibition by pathogenic mutations. Science 288, 2354–62.
- Sperandio, S. et al. (2000) An alternative, non-apoptotic form of programmed cell death. Proc. Natl. Acad. Sci USA 97, 14376–81.
- Tewari, M. and Dixit, V.M. (1995) Fas- and tumor necrosis factor-induced apoptosis is inhibited by the poxvirus crmA gene product. J. Biol. Chem. 17, 3255–60.
- Tsujimoto, Y. and Croce, C.M. (1986) Analysis of the structure of transcripts and protein products of bcl-2, the gene involved in human follicular lymphoma. Proc. Natl. Acad. Sci USA 83, 5214–8.
- van Genderen, H. et al. (2003) Membrane alterations in dying cells. In: Cell Proliferation and Apoptosis. Hughes, D and Mehmet, H., eds. 185–200. (Bios Scientific Publishers, Ltd. Oxford)
- Wajant, H. et al. (2003) Death Receptors. In: Essays in Biochemistry. Cotter, T. et al. eds. 39, 53–71. (Cold Spring Harbor Laboratory Press, Plainview, N.Y.)
- Waterhouse, N.J. et al. (2003) Mitochondrial outer-membrane permeabilization in apoptosis. In: Cell Proliferation and Apoptosis. Hughes, D. and Mehmet, H., eds. 185–200. (Bios Scientific Publishers, Ltd. Oxford)
- Williamson, P., et al. (2000) Phosphatidylserine exposure and phagocytosis of apoptotic cells. Meth. Cell Biol. 66, 339–64.
- Wyllie, A. H. (1980) Glucocorticoid-induced thymocyte apoptosis is associated with endogenous endonuclease activation. Nature 284, 555–6.
- Yuan, J. and Yankner, B.A. (2000) Apoptosis in the nervous system. Nature 407, 802–9.
- Yuan, J. et al. (1993) The C. elegans cell death gene ced-3 encodes a protein similar to mammalian interleukin-1-beta-converting enzyme. Cell. 75, 641–52.
- Zamzami, N. et al. (2000) Quantitation of mitochondrial transmembrane potential in cells and in isolated mitochondria. In: Methods Enzymol. Reed J.C., ed. 322, 208–13.
- Zou, H. et al. (1997) Apaf-1, a human protein homologous to C. elegans CED-4, participates in cytochrome-c dependent activation of caspase-3. Cell 90, 405–13.
Anti-ACTIVE, Apo-ONE, Caspase-Glo, CellTiter-Blue are CellTiter 96 are trademarks of Promega Corporation and are registered with the U.S. Patent and Trademark Office. CaspACE, CytoTox-ONE, DeadEnd, and EnduRen are trademarks of Promega Corporation.
Cy is a registered trademark of Amersham Biosciences Ltd. FACS is a registered trademark of Becton Dickinson and Company. HemoDe is a registered trademark of Scientific Safety Solvents. FluoroNunc is a trademark of Nalge Nunc International. Lab-Tek is a registered trademark of Nalge Nunc International. NANOpure are registered trademarks of Barnstead/Thermolyne Corporation. Parafilm is a registered trademark of American National Can Company. PolyPrep is a registered trademark of Bio-Rad Laboratories, Inc. Prionex is a registered trademark of Pentapharm Ltd. SlowFade is a registered trademark of Molecular Probes, Inc. Superfrost is a registered trademark of Erie Scientific. Triton is a registered trademark of Union Carbide Chemicals and Plastics Technology Corporation. Tween is a registered trademark of ICI Americas, Inc.VECTASHIELD is a registered trademark of Vector Laboratories, Inc.
Products may be covered by pending or issued patents or may have certain limitations. Please visit our web site for more information.
All prices and specifications are subject to change without prior notice.
Product claims are subject to change. Please contact Promega Technical Services or access the Promega online catalog for the most up-to-date information on Promega products.