A Guide to Forensic DNA Interpretation and Linkage
1ESR. Private Bag 92021, Auckland 1142, New Zealand 2Statistics Department, University of Auckland, New Zealand 3Promega Corporation
Publication Date: 2014
Abstract
Linked loci are those that are physically close to each other on a chromosome and are therefore not transmitted independently. As commercial STR kits expand to meet the needs of the forensic community more linked loci are being introduced. Within this paper we outline how to identify the problem and provide examples of how to manage linked loci when calculating match probabilities and in kinship analysis.
Introduction
As commercial STR testing kits expand to fulfill the requirements of the forensic community, some syntenic loci have been selected. Syntenic loci are those on the same target chromosome as existing loci. Some of the selected syntenic loci are close enough on the chromosome to be loosely linked. The effect of linked loci on forensic DNA profile interpretation, whilst not a new issue, generally is not well understood by the community. Here we describe the problem, discuss when linked loci should be taken into consideration when reporting forensic DNA profiling results and provide possible strategies to account for linkage in these situations.
Linkage and Linkage Disequilibrium
Linkage: Loci that are physically close to each other on a chromosome and are not passed on independently to the next generation are said to be linked. A measure of distance between two loci is termed a centiMorgan (cM) and is defined as the distance between loci at which there is a 1% chance that a marker at one genetic locus will be separated from a marker at another locus due to a recombination event in a single generation (meiosis). One centiMorgan equates to a recombination fraction of 0.01. The recombination fraction for loci that assort independently, and are therefore not linked, is 0.50. The relationship between physical distance and recombination is linear for only a short range of up to approximately 18cM (1) . A distance of 50cM does not equate to a recombination fraction of 0.50. Kosambi’s mapping function can be used to calculate recombination rates (R) from genetic map distances (2) .
Linkage disequilibrium is a phrase used to describe the nonrandom association of alleles at different loci within a population. Linkage disequilibrium can be caused by linkage or other population genetic effects such as population substructure, selection and drift.
It is a common misconception that only linked loci are in linkage disequilibrium. All loci will be in disequilibrium following an evolutionary event such as admixture of two populations. Those loci that are not linked can regain equilibrium in fewer generations than those that are linked. Not all linked loci show linkage disequilibrium.
Linked Loci
In Table 1, a summary of linked loci present in modern commercial multiplexes and their distances is reproduced in part from Phillips et al. (1) who used HapMap data to measure genetic distances (in cM) and calculated recombination rates. The distance between D21S11 and Penta D was previously reported to be 50cM (3) .
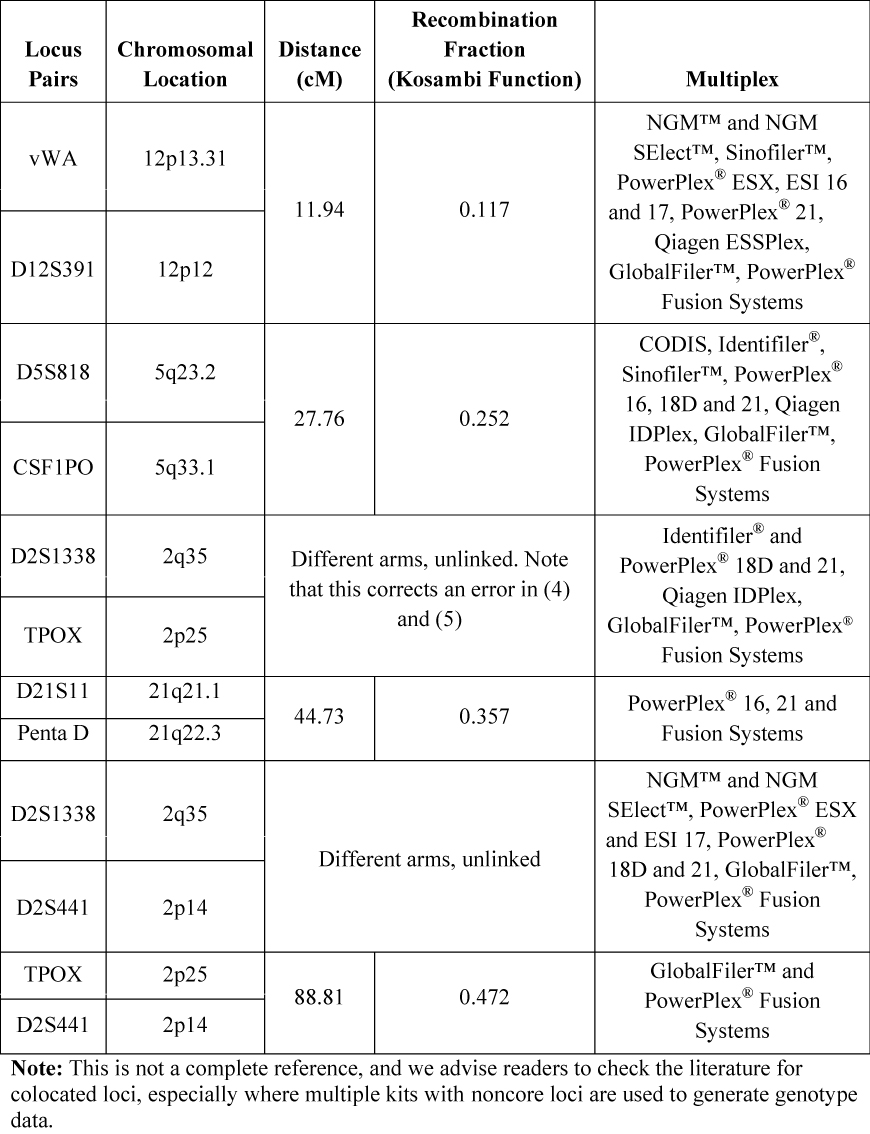 Table 1. Examples of Loci Colocated on the Same Chromosome, Their Distance Apart, Recombination Fraction and the Common Commercial STR Multiplexes in Which They are Present.
 Increases in the number of new loci present in commercial forensic STR multiplexes have the desired effect of increasing discrimination power and making match probabilities smaller. The very large discriminating power of modern multiplexes means that the match probability for related and unrelated people is very low. However, as data for additional loci is included in the calculation, the match probability for related people is reduced more slowly than for unrelated people. Therefore, the match probabilities for non-excluded close relatives become increasingly important forensically. The effect of linkage should be considered for certain familial relationships (4) .
Impact on Casework
We believe that there is sufficient distance between the loci listed in Table 1 to avoid linkage disequilibrium at the population level. The closest pair of linked loci within current commercial multiplexes are vWA and D12S391. A number of researchers have reported that there is no evidence for linkage disequilibrium at the population level between vWA and D12S391 (6) (7) (8) (9) . The lack of observed linkage disequilibrium is likely to be due to allele re-assortment through recombination over sufficient generations.
However, the distances between the linked loci in the commercial multiplexes in Table 1 are sufficiently small that they will affect match probabilities extending over only a few generations such as for relatives and some instances of pedigree analysis.
Dealing with Linked Loci in Forensic Calculations
Match Probabilities
The match probabilities for parent/child relationships are unaffected by linkage. However, those for siblings, half-siblings, uncle/nephew, cousins and grandparent/grandchild relationships are affected. The effect is typically not large. It is smallest for common alleles and largest for rare alleles (5) . We give the percentage overstatement of the likelihood ratio (LR) for the most common profile in the New Zealand (NZ) Caucasian and Asian subpopulations in Table 2. Generally, the difference in match probabilities decreases as the distance within the pedigree increases between the individuals under consideration.
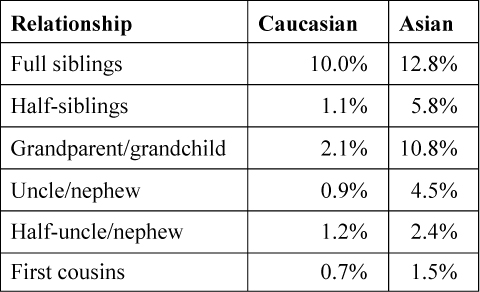 Table 2. Overstatement of Match Probabilities When Linkage is Not Considered for Different Relationships for the Most Common Profile in the New Zealand Caucasian and Asian Subpopulations.
 There may be temptation to avoid making any correction for linkage because of the complexity of the analysis and the relatively small differences. However, match probabilities are always non-conservative if linkage is ignored, but typically by a small amount. Any approximate analysis that runs a risk of overstatement of the LR must come under court scrutiny, and we suggest that it is right and proper to perform the appropriate calculations. The provision of software with the capability to account for linkage in appropriate relationship scenarios would be most useful.
Bright et al. (5) report an approach to estimating match probabilities given linkage and taking into account subpopulation effects (a theta correction). The number of possible combinations to two-locus genotypes for two people and possible relationships is too large to tabulate. We reproduce the operative aspects of the Bright et al. approach in a stepwise formulation to create the match probability that an individual has genotype G1 given that a relative has genotype G2.
Step 1. Identify the pair of linked loci within the multiplex used, and determine the recombination fraction, R, from Table 1. Note that R = 1 – R.
Step 2. Find the Zij values for the relationship under consideration from Table 3. Zij is the probability of i identical by descent (IBD) alleles at locus 1 and j IBD alleles at locus 2. As an example, Z11 assumes that one allele at each locus is IBD.
Step 3. Find the Ai and Bi values for the two genotypes being considered from Table 4. Within Table 4 alleles are designated p, q, r or s. Ai is the probability of the second genotype given the first genotype where the IBD state at locus 1 is i. As an example, A2 signifies two alleles are IBD (which is only possible for full sibs), A1 signifies one allele is IBD and A0 no alleles are IBD where any shared alleles are therefore identical by state (IBS). Bi is the probability of the second genotype given the first genotype where the IBD state at locus 2 is i.
Step 4. Find the values for the terms C to Y from Table 5.
Step 5. Calculate:
Pr (G1,G2 | Relationship) = A0B0Z00 + A0B1Z01 + A0B2Z02 + A1B0Z10 + A1B1Z11 + A1B2Z12 + A2B0Z20 + A2B1Z21 + A2B2Z22
The Z2 terms are only considered when calculating match probabilities for full siblings.
Step 6. Divide this result by Pr(G2), which may be calculated without any consideration of linkage.
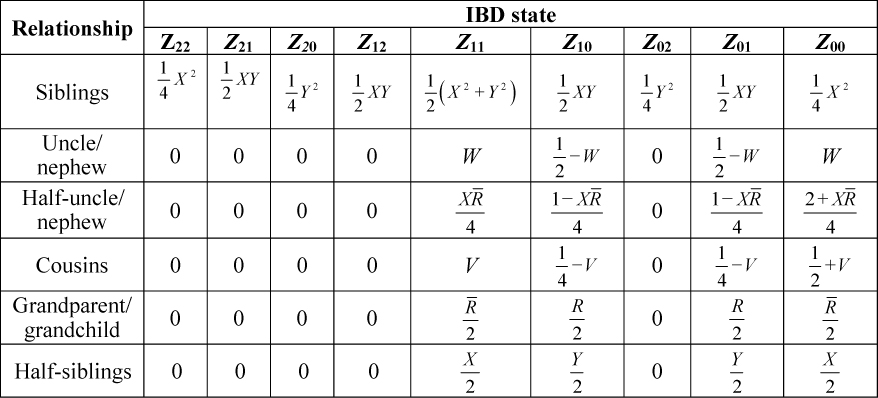 Table 3. Probability of Two-Locus IBD States for Some Common Relationships Accounting for Linkage.
 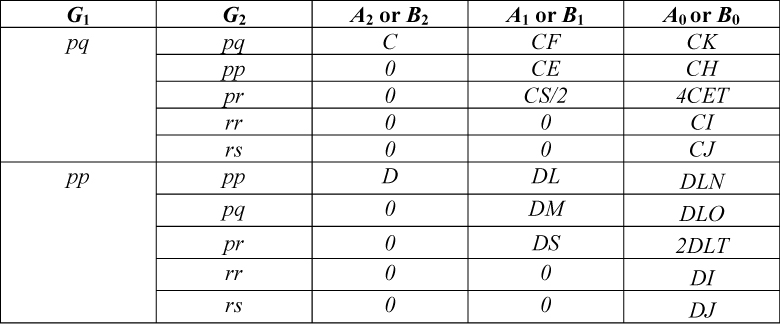 Table 4. Probabilities for the Ai and Bi Terms Used to Form the Joint Probability of G1 and G2, Where p, q, r and s Signify Designated Alleles.
 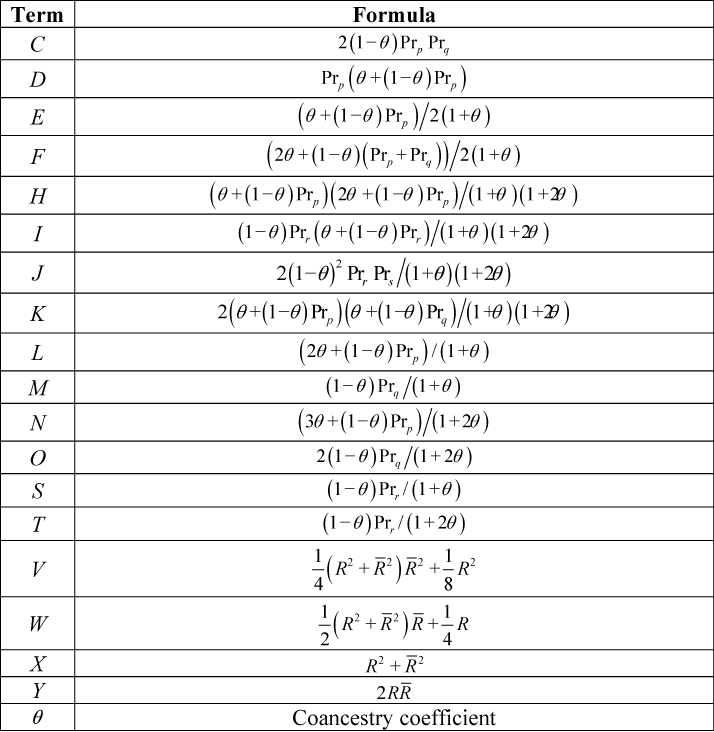 Table 5. A Summary of the Terms Used in this Paper. Note that Equation I Differs from That in (5), Correcting a Misprint in that Work.
 Match Probabilities—a Worked Example
Consider a DNA profile typed using the PowerPlex® ESI 16 multiplex, which has one pair of linked loci: vWA and D12S391. The DNA profile obtained from a crime sample collected from the crime scene is typed as vWA 17,17 and D12S391 18,20 and corresponds to the person of interest’s reference profile (G1). The prosecution hypothesis (H1) is that the person of interest is the donor of the DNA. The alternate (defence) hypothesis (H2) is that an untyped half-brother (G2) is the donor of the DNA. We require the likelihood ratio for these two hypotheses. The terms for the calculation are presented in Table 6, where R = 0.117 and R = 0.883 from Table 1; allele frequencies are taken from the Caucasian subpopulation published within Tucker et al. (10) and θ = 0.02.
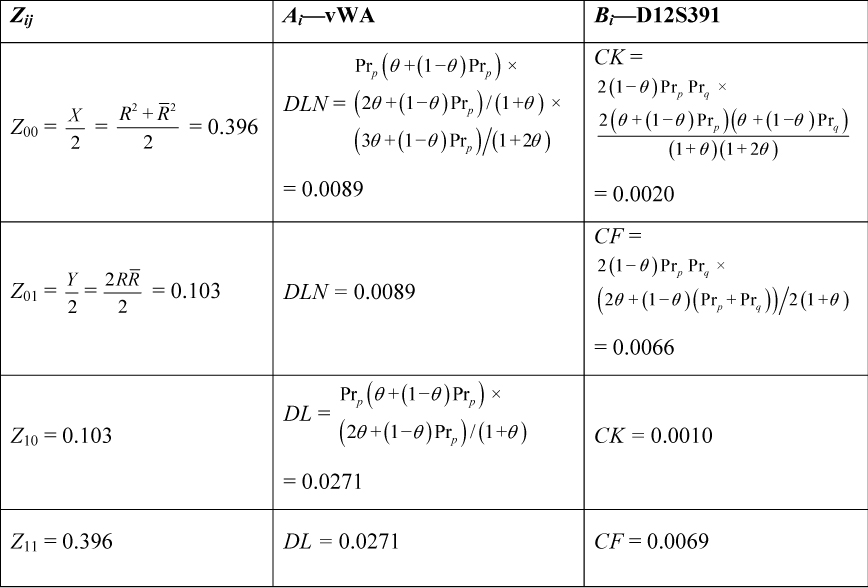 Table 6. A Worked Example.
 The joint probability is calculated using the following formula:
Pr(G1,G2 | Half-sibs) = A0B0Z00 + A0B1Z01 + A1B0Z10 + A1B1Z11 = 8.99 × 10⁻⁵
The conditional probability [“it was not me, it was my half-brother”, Pr(G2|G1, half-brothers)] is calculated by dividing the joint probability by Pr(G1). Pr(G1) = 0.00355 is calculated by multiplication of terms C (for the heterozygote locus D12S391) and D (for the homozygote locus vWA) from Table 5 after substitution of the relevant allele frequencies. The joint probability divided by Pr(G1) gives 0.0254. Therefore the LR is 1/0.0254 = 39.4.
Pedigree Analysis
Linkage may or may not have an effect on the LR in pedigree analysis. There are some diagnostics that may be used to determine whether there is an effect. The following conditions must be met:
- At least one individual in the pedigree (the central individual) is involved in at least two transmissions of genetic material, either as a parent or a child, and
- that individual is a double heterozygote at the loci in question (4) and
- the pedigree must be informative of phase.
Each of these conditions is discussed in turn. Pedigrees are given in Figure 1 for different relationships. The central individual (or individuals) who have undergone two meioses are identified in the pedigrees with filled symbols. The symbols for all other individuals are empty. There may be confusion regarding the double heterozygote condition. As an example, if we imagine one sib who is a homozygote at both linked loci, then one possible genotype state of their parents (who are untyped) is that they are heterozygote at those linked loci and therefore linkage must be taken into account. The first step in identifying affected pedigrees is to complete the pedigree. Consider a grandparent/grandchild pedigree where the parent (the central individual) is not available for typing. It is important to note that this person is still present in the pedigree even though we do not have their genotype; however, their genotype may be inferred in full or in part from the types of their parents and child or children.
If the central individual(s) are not double heterozygotes, then there is no effect of linkage. Even if these conditions are both met there is still no effect on the probability of the pedigree unless there is some information in the pedigree that informs phase of this double heterozygote individual (4) . Phase is a particular association of alleles at different loci representing the original allelic combinations from an individual’s parents.
If any of these conditions are not met, then there is no effect of linkage on this pedigree, and the standard formulae may be used. However, there is an effect of linkage on pedigree analysis if all three conditions are met. The effect may be to raise or lower the LR (11) . The LRs were generally slightly underestimated in the pedigrees studied by O’Connor and Tillmar (11) . However, in one incestuous pedigree, it was overestimated by a factor of up to 30. The probability of the pedigree will always be overestimated if recombination is required to explain the genotypes and if linkage is ignored. In most kinship analyses this translates to an inflated LR. In addition, O’Connor and Tillmar warn that dropping one locus is not necessarily conservative.
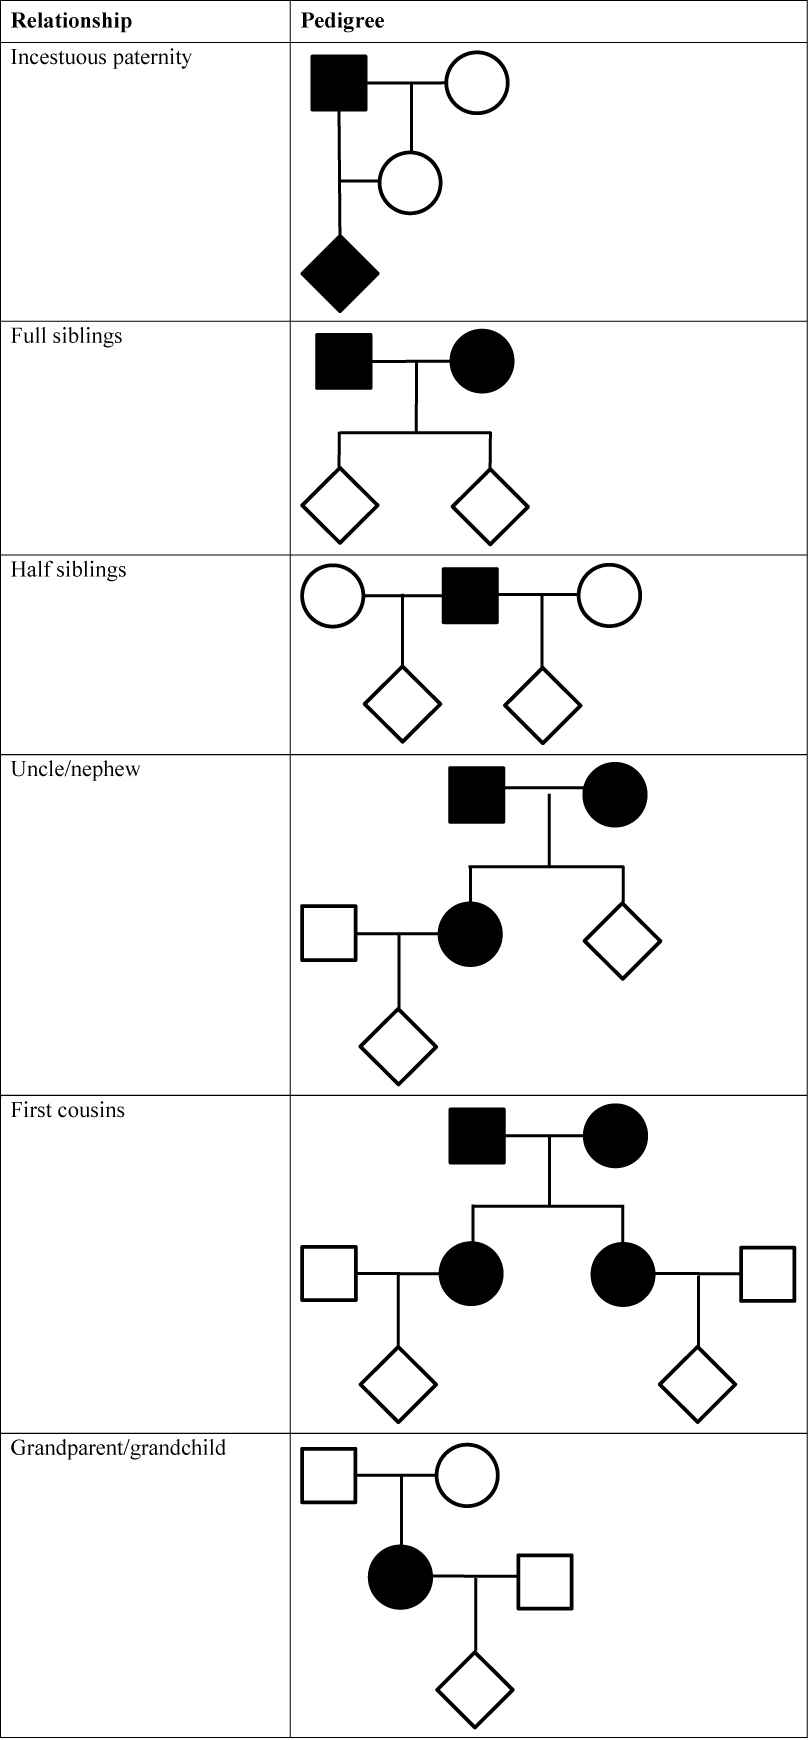 Figure 1. Examples of pedigrees where linkage should be considered. The central individual who has undergone two meioses is represented as a filled symbol.
 Conclusions
As the size of modern STR multiplexes increase, more and more loci within commercial kits are linked. Linked loci mean that loci are not transmitted independently, and this must be taken into account when calculating some match probabilities and in some kinship analysis. The match probabilities for parent/child relationships are unaffected by linkage; however, those for siblings, half-siblings, uncle/nephew, cousins and grandparent/grandchild are affected. Generally, the difference in match probabilities decreases as the distance within the pedigree increases between the individuals under consideration.
Linkage may or may not have an effect on the LR in pedigree analysis. At least one individual in the pedigree (the central individual) must be involved in at least two transmissions of genetic material and be a double heterozygote at the loci in question for linkage to have an effect. Information about phase must be available from the pedigree before the effect of linkage can be assessed and accounted for in any subsequent calculation.
Software is available, FamLink, that can easily take into account linkage but not linkage and coancestry between pairs of loci for pedigree analyses (12) .
Article References
- Phillips, C. et al. (2012) The recombination landscape around forensic STRs: Accurate measurement of genetic distances between syntenic STR pairs using HapMap high density SNP data. Forensic Sci. Int. Genet. 6, 354–65.
- Kosambi, D.D. (1944) The estimation of map distance from recombination values. Annals of Eugenics 12, 172–5.
- Buckleton, J.S. and Triggs, C.M. (2006) The effect of linkage on the calculation of DNA match probabilities for siblings and half siblings. Forensic Sci. Int. 160, 193–9.
- Gill, P. et al. (2012) An evaluation of potential allelic association between the STRs vWA and D12S391: Implications in criminal casework and applications to short pedigrees. Forensic Sci. Int. Genet. 6, 477–86.
- Bright, J.A., Curran, J.M. and Buckleton, J.S. (2013) Relatedness calculations for linked loci incorporating subpopulation effects. Forensic Sci. Int. Genet. 7, 380–3.
- Budowle, B. et al. (2010) Population genetic analyses of the NGM STR loci. Int. J. Legal Med. 125, 101–9.
- Phillips, C. et al. (2011) Analysis of global variability in 15 established and 5 new European Standard Set (ESS) STRs using the CEPH human genome diversity panel. Forensic Sci. Int. Genet. 5, 155–69.
- O'Connor, K.L. et al. (2011) Linkage disequilibrium analysis of D12S391 and vWA in U.S. population and paternity samples. Forensic Sci. Int. Genet. 5, 538–40.
- O'Connor, K.L. et al. (2011) Corrigendum to “Linkage disequilibrium analysis of D12S391 and vWA in U.S. population and paternity samples” [Forensic Science International: Genetics., doi:10.1016/j.fsigen.2010.09.003]. Forensic Sci. Int. Genet. 5, 541–2.
- Tucker, V.C. et al. (2012) UK population data generated with the PowerPlex® ESI 16 system. Forensic Sci. Int. Genet. 6, e112–8.
- O'Connor, K.L. and Tillmar, A.O. (2012) Effect of linkage between vWA and D12S391 in kinship analysis. Forensic Sci. Int. Genet. 6, 840–4.
- Kling, D., Egeland, T. and Tillmar, A.O. (2012) FamLink — A user friendly software for linkage calculations in family genetics. Forensic Sci. Int. Genet. 6, 616–20.
How to Cite This Article
Scientific Style and Format, 7th edition, 2006
Bright, J.A. et al. A Guide to Forensic DNA Interpretation and Linkage. [Internet] 2014. [cited: year, month, date]. Available from: https://www.promega.com/resources/profiles-in-dna/2014/a-guide-to-forensic-dna-interpretation-and-linkage/
American Medical Association, Manual of Style, 10th edition, 2007
Bright, J.A. et al. A Guide to Forensic DNA Interpretation and Linkage. Promega Corporation Web site. https://www.promega.com/resources/profiles-in-dna/2014/a-guide-to-forensic-dna-interpretation-and-linkage/ Updated 2014. Accessed Month Day, Year.
Contribution of an article to Profiles in DNA does not constitute an endorsement of Promega products.
PowerPlex is a registered trademark of Promega Corporation.
GlobalFiler, NGM, NGM SElect and Sinofiler are trademarks of Life Technologies. Identifiler is a registered trademark of Applied Biosystems.