PowerPlex® ESI Systems: D12S391 and D2S441. Resolving Alleles With Single-Base-Pair Size Differences
1Promega Corporation, 2Biological Industries, kibbutz Beit Haemek, Israel
Publication Date: 2013
In some cases, the data analysis parameters in the GeneMapper® software can be adjusted, in accordance with the Applied Biosystems GeneMapper® user manual, to analyse the data. For example, the polynomial degree and peak window can be modified to adjust the sensitivity of peak detection (Figure 1, Panels A and B). However, we have observed that alleles separated by a single base cannot always be fully resolved using the GeneMapper® software in some samples despite the alleles being visually different on the electropherogram (Figure 2). We have found that the SoftGenetics analysis software, GeneMarker® HID, version 2.4.0, can be useful in analysing some of these samples (Figure 3).
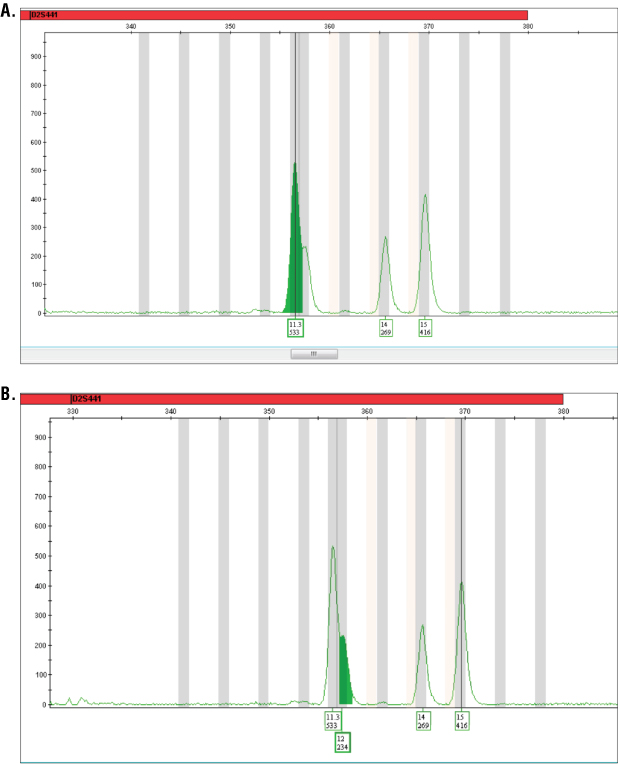 Figure 1. Analysis of PowerPlex® ESI 16 System data using GeneMapper® ID software.
 Panel A. Analysis of a sample using a peak window size of 7 or above results in the 12 allele being unavailable for automatic or manual labelling. Panel B. Analysis parameters modified to peak window size of 5 allows automatic labelling of the 12 allele with this sample.
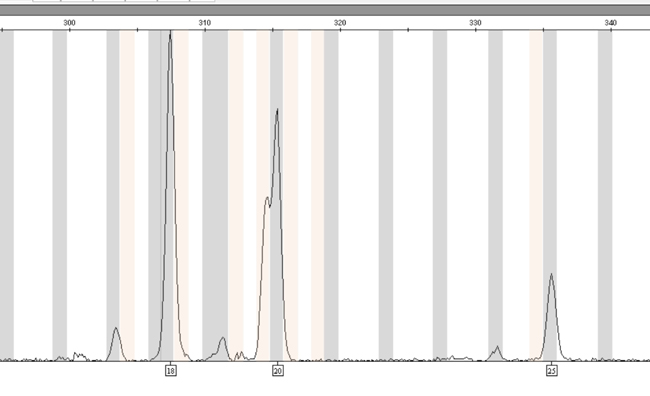 Figure 2. A mixed DNA sample exhibiting 18, 19.3, 20 and 25 alleles at D12S391.
 The 19.3 and 20 alleles are eluted close together, and the GeneMapper® ID-X software, version 1.2.1, allows selection of only the 20 allele, despite the presence of both the 19.3 and 20 alleles.
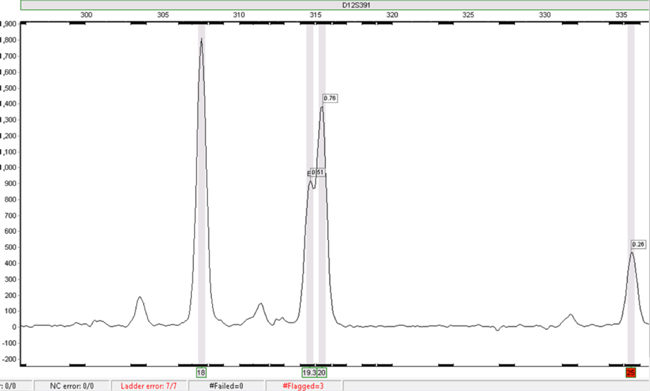 Figure 3. The same data as in Figure 2 analysed using SoftGenetics GeneMarker® HID software.
 The D12S391 18 and 20 alleles in this sample file were called automatically. The 25 allele is highlighted in red, signifying that it requires checking. The 19.3 allele can be called by selecting the peak and manually adding the call.
Where this issue with data analysis of alleles separated by a single base occurs, we recommend that wherever possible you:
- check the resolution of the CE instrument, make improvements if necessary and re-run the sample.
- reprocess the DNA samples using the PowerPlex® ESX System, where the loci prone to this issue are of a lower molecular weight and more likely to exhibit good resolution on the CE instruments (Figure 4).
- analyse the CE data using an alternative software (e.g., GeneMarker® HID, version 2.4.0, from SoftGenetics).
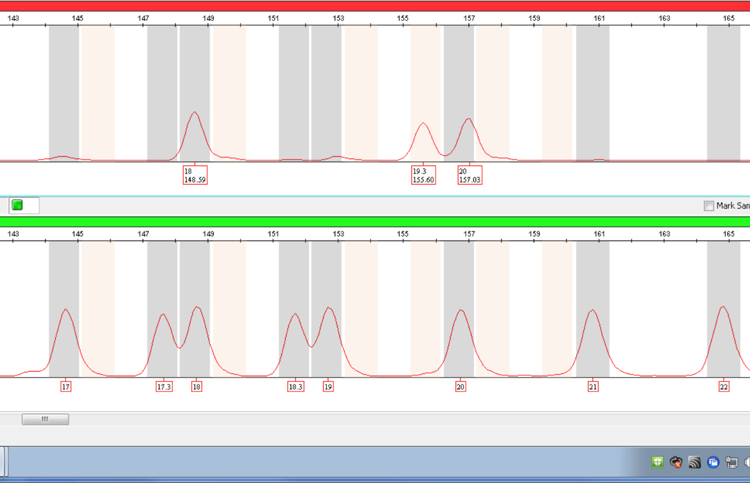 Figure 4. The same sample as in Figure 2 amplified using the PowerPlex® ESX System showing resolution of the 19.3 and 20 alleles at D12S391 at lower molecular weight.
 Note that the size difference between the two alleles is 1.43bp rather than the expected approximately 1bp. The 20 allele is likely to be comprised of a different repeat sequence compared with alleles 18 and 19.3.
Acknowledgments
The authors would like to thank the members of the Forensic Biology Laboratory, Division of Identification and Forensic Science (DIFS), at the Israel Police for their contribution of data.
How to Cite This Article
Scientific Style and Format, 7th edition, 2006
Hopwood, A. and Davidson, A. PowerPlex® ESI Systems: D12S391 and D2S441. Resolving Alleles With Single-Base-Pair Size Differences. [Internet] 2013. [cited: year, month, date]. Available from: https://www.promega.com/resources/profiles-in-dna/2013/powerplex-esi-systems-resolving-alleles-with-single-base-pair-size-differences/
American Medical Association, Manual of Style, 10th edition, 2007
Hopwood, A. and Davidson, A. PowerPlex® ESI Systems: D12S391 and D2S441. Resolving Alleles With Single-Base-Pair Size Differences. Promega Corporation Web site. https://www.promega.com/resources/profiles-in-dna/2013/powerplex-esi-systems-resolving-alleles-with-single-base-pair-size-differences/ Updated 2013. Accessed Month Day, Year.
Contribution of an article to Profiles in DNA does not constitute an endorsement of Promega products.
PowerPlex is a registered trademark of Promega Corporation.
Applied Biosystems and GeneMapper are registered trademarks of Applied Biosystems. GeneMarker is a registered trademark of SoftGenetics Corporation.