Examination of Proposed Manufacturing Standards Using Low Template DNA
Promega Corporation
Publication Date: 2013
Introduction
Low-level DNA contamination is a constant concern in the forensic DNA community. With the increasing sensitivity of short tandem repeat (STR) amplification systems, levels of DNA that were previously undetected are now generating partial profiles. Laboratories depend on reagent and plastics manufacturers to supply high-quality products produced under conditions that minimize the risk of introducing exogenous DNA. Recently, the United Kingdom and Australia proposed standards PAS377 (1) and AS 5483 (2) , respectively, for minimizing the risk of human DNA contamination events during the manufacturing process. Each standard has separate guidelines for products used in database and casework sample analysis, with casework guidelines being more stringent. STR testing and quantitative polymerase chain reaction (qPCR) testing are addressed in each standard as methods for quality control (QC) testing and detection of <200pg of DNA [low template DNA (LTD)]. However, the UK standard allows only STR QC testing for casework products. The purpose of this paper is to obtain baseline data to evaluate and compare potential QC test method parameters that will meet the proposed standards. To this end, we investigated the level of input DNA that will reflect passing criteria of the proposed standards for casework products, compared the sensitivities of two capillary electrophoresis (CE) instruments—the Applied Biosystems® 3130 and 3500 Genetic Analyzers—and compared qPCR and STR testing methods.
The standards propose requirements that must be met for “DNA Free” or Forensic DNA Grade product claims. The PAS377 criterion for casework products is that “no individual samples shall have either more than one allelic peak of greater than 50 relative fluorescent units (RFU) or the threshold value for calling a heterozygote allele peak by the analytical method used as reproduced by replicate analysis”. Based on the 50RFU threshold, we infer detection using a 3130 instrument rather than a 3500 instrument, which has a higher analysis threshold; therefore, we included a 3500 instrument in our testing. In addition, a common sentiment from the forensic community is that the assay used to perform QC tests be “sensitive enough to detect a single cell” (3) . However, any STR assay used to support a Forensic DNA Grade claim is only as sensitive as the detection instrument used (i.e., the CE instrument). To understand how to meet these requirements, we first evaluated the sensitivities of the 3130 and 3500 instruments by testing the baseline noise and determining where allelic drop-out occurs. We then compared instrument sensitivities by evaluating the lowest level of input DNA that we could detect using a variety of injection parameters and analysis thresholds. Next we determined the amount of input DNA required to produce a single allelic peak. We also determined the number of alleles detected from an amount of input DNA equivalent to a single cell. Finally, we compared the sensitivity of qPCR and STR amplification.
Materials and Method
We performed all STR amplification reactions using the PowerPlex® Fusion System (Cat.# DC2402) and a GeneAmp® 9700 PCR System thermal cycler following the recommendations in the PowerPlex® Fusion System Technical Manual #TMD039. We performed qPCR experiments using the Plexor® qPCR System (Cat.# A4011) following the recommendations in the Plexor® qPCR System Technical Manual #TM262.
Capillary Electrophoresis Conditions
For STR analysis, we used the default injection parameters of a 5-second 3kV injection for the 3130 instrument and analyzed amplified samples with a threshold of 25RFU, which is lower than the manufacturer’s default threshold of 50RFU. We used the manufacturer’s default settings of a 15-second 1.2kV injection for the 3500 instrument and analyzed samples using the manufacturer’s default threshold of 175RFU as well as a lower threshold of 90RFU. We used an additional 24-second 1.2kV injection parameter on the 3500 instrument as an enhanced setting. The enhanced setting was based on the PAS377 recommendation to perform “enhanced PCR and analysis conditions, such as increased cycle number and/or increased capillary injection for the STR profiling kit used”. We chose to increase injection time rather than increase cycle number as the cycle number is optimized by manufacturers during development of the STR systems. STR data were analyzed using the GeneMapper® ID-X software, version 1.2.
Examining the Sensitivity of Capillary Electrophoresis Instrumentation Without Stochastic Influences
To determine the CE sensitivity without the influence of PCR effects, we amplified a robust amount of input DNA (500pg) so that any allelic dropout observed would not be a result of stochastic effects during amplification. The amplified product was serially diluted and injected onto the CE instrument. To eliminate preferential injection of the DNA, we used 1X PowerPlex® Fusion Master Mix as the diluent.
Samples were loaded in triplicate and analyzed using the 3500 instrument and the standard 15-second 1.2kV injection as well as the enhanced 24-second 1.2kV injection. Each set of injections was analyzed using thresholds of 175RFU and 90RFU.
Examining Capillary Electrophoresis Baseline Noise
To better understand the baseline noise on the 3130 and 3500 instruments without the influence of stochastic effects from PCR, we injected a set of no-amplification controls on each instrument. The no-amplification samples were comprised of PowerPlex® Fusion 5X Primer Pair Mix and 5X Master Mix diluted to 1X with water. One microliter of this mix was loaded into 94 wells of a 96-well plate containing 10µl of Hi-Di™ formamide and 1µl of CC5 Internal Lane Standard 500 (CC5 ILS 500; Cat.# DG1521) per well. The PowerPlex® Fusion Allelic Ladder Mix was the positive control, and a no-input well (only Hi-Di™ formamide and CC5 ILS 500) was used as the negative control. Samples were analyzed using a 5-second, 3kV injection on the 3130 instrument and a 24-second, 1.2kV injection on the 3500 instrument, and data were analyzed using thresholds of 25RFU on the 3130 instrument and 90RFU on the 3500 instrument.
Evaluating the Practical Definition of Forensic Grade/”DNA Free” Through Serial Dilutions of Input DNA and STR Amplification
Three scientists (operators A, B and C) each prepared two sets of serial human genomic DNA dilutions for STR analysis. One dilution set ranged from 100pg to 0.001pg (1fg), and the second set ranged from 67pg to 0.067pg. This enabled testing of a broad range of input DNA amounts, including an amount of DNA equivalent to a single human cell (approximately 6.7pg (4) ). All DNA dilutions were amplified in triplicate with the maximum input volume of 15µl, then analyzed using the 3130 instrument with a 5-second injection and the 3500 instrument with a 24-second injection. This initial round of testing was designed to determine which instrument, the 3130 or 3500, was more sensitive. This experiment was repeated to determine what level of input DNA yielded a single allelic peak using only the 3500 instrument with 15- and 24-second injections. The DNA profiles generated were compared to the known genotype of the sample to determine the percentage of alleles obtained and detect potential contamination or allelic drop-in.
Determining qPCR Sensitivity by Testing with Mitochondrial DNA Primers
qPCR testing was conducted using human-specific mitochondrial DNA (mtDNA) primers. Mitochondrial DNA is present in cells at a higher concentration (on average 500 copies per cell (4) ) than nuclear DNA (one pair of each chromosome per cell). As such, we expect the mtDNA qPCR method to increase greatly the chance of detecting low levels of human DNA. Two experiments were designed to determine 1) if qPCR is as effective as STR analysis in detecting contaminating DNA in nuclease-free water and 2) which assay could detect the lowest level of known DNA amounts.
Eighty tubes of nuclease-free water (Cat.# P1193) were tested using the Plexor® qPCR System. The reaction mix was prepared as described in the Plexor® qPCR System Technical Manual using human-specific mtDNA primers, and 5µl from each tube of nuclease-free water was added to 20µl of Plexor® reaction mix. Standard reference templates were prepared using four replicates of human genomic DNA, targeting 10pg, 1pg or 0.1pg. Four negative controls were run using Water, Amplification Grade (Cat.# DW0991), which contains less than 1pg of contaminating DNA as tested by qPCR analysis. Samples were amplified using an Applied Biosystems 7500 FAST PCR System for 40 cycles.
We further characterized samples that generated a quantification cycle (Cq) value, along with 33 samples that did not generate a Cq value, in STR amplification. A positive control with 500pg of template DNA and a negative control were included. We added the maximum input volume (15µl) of sample to each amplification. We then analyzed amplified samples using a 3130 instrument (5-second injection and 25RFU threshold) and a 3500 instrument (24-second injection and 90RFU threshold).
This experiment was followed by an experiment to determine which assay had better sensitivity: qPCR using mtDNA primers or STR analysis. The Plexor® qPCR and PowerPlex® Fusion Systems were tested again, with reactions set up as directed by their respective technical manuals. Serial dilutions of DNA template were prepared at 66.7pg/µl to 0.0000667pg/µl. The DNA dilutions and negative controls (Water, Amplification Grade) were amplified in triplicate for both the qPCR and STR amplification reactions. qPCR was performed using an Applied Biosystems 7500 FAST PCR System for 45 cycles. The PowerPlex® Fusion reactions were amplified and analyzed using the 3500 instrument with 15- and 24-second injections and 90RFU and 175RFU thresholds.
Results and Conclusions
Examining the Sensitivity of Capillary Electrophoresis Instrumentation Without Stochastic Influences
Experiments to evaluate CE sensitivity using dilutions from the amplified product (500pg of input DNA) yielded complete profiles down to a 1:10 dilution for all CE injection times and threshold combinations. Using the most sensitive injection parameter, a 24-second injection analyzed with a 90RFU threshold, we also obtained complete profiles at the 1:50 dilution (Table 1). Using the manufacturer’s default setting for the 3500 instrument (15-second injection, 175RFU threshold), we observed no peaks above the analysis threshold at or beyond the 1:300 dilution. With the enhanced parameter of a 24-second injection and lower threshold of 90RFU, there were single alleles above threshold in each replicate at the 1:1,000 dilution. However, there were several peaks below the threshold as well (Figure 1). This shows that the CE instrumentation is unaffected by drop-out down to a 1:10 dilution (~50pg) of amplified DNA with all injection parameters tested.
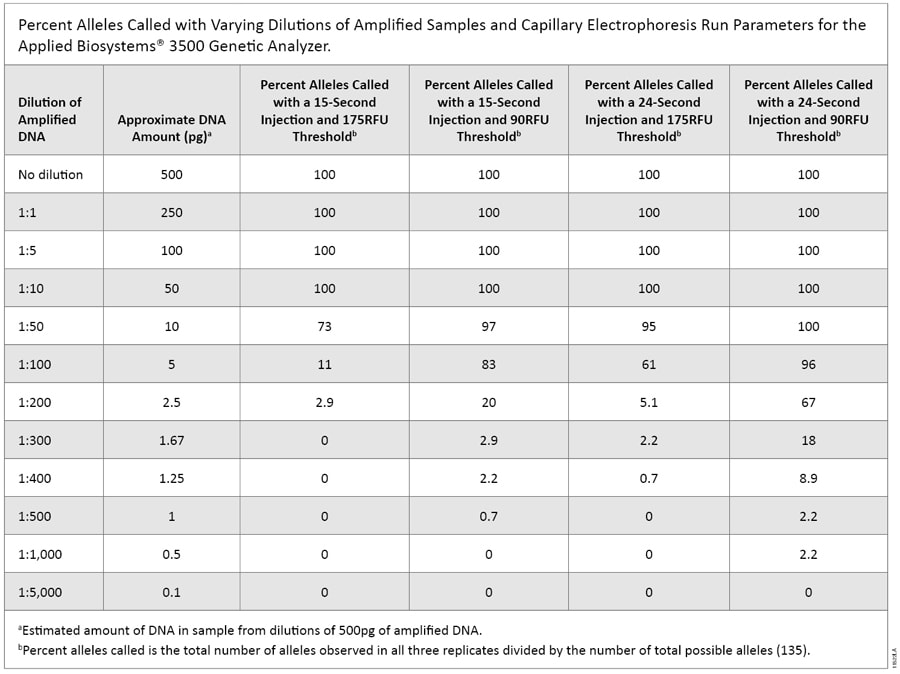 Table 1. Percent Alleles Called with Varying Dilutions of Amplified Samples and Capillary Electrophoresis Run Parameters for the Applied Biosystems® 3500 Genetic Analyzer.
  Figure 1. Representative electropherogram of a 500pg amplified sample diluted to 1:1,000 (~0.5pg).
 Sample was analyzed using an Applied Biosystems® 3500 Genetic Analyzer, a 24-second injection and a 90RFU threshold.
Examining Capillary Electrophoresis Baseline Noise
CE-produced baseline noise was examined. All CE spikes and no-amplification artifacts mentioned in the PowerPlex® Fusion System Technical Manual were excluded from analysis as they are known products of CE instrumentation and STR amplification, respectively. Of the 94 sample injections on the 3130 instrument (5-second injection and 25RFU threshold), 92 were free of peaks above threshold, and two injections gave no sizing data due to poor ILS injection. None of the 94 sample injections on the 3500 instrument (24-second injection and 90RFU threshold) exhibited peaks above threshold. Thus, there is nothing inherent to the CE instruments that yield sporadic allelic peaks under the conditions tested.
Evaluating the Practical Definition of Forensic Grade/”DNA Free” By Amplifying Serial Dilutions of Input DNA
The first serial dilution experiment was designed to compare CE instrument sensitivities. The 3130 data were analyzed using a threshold of 25RFU and a 5-second injection. Alleles were detected down to 0.067pg, with 2.2% of expected alleles called (Table 2). For the 3500 instrument using a 24-second injection and either a 90RFU or 175RFU threshold, one allele (0.74% of total alleles) was detected at 0.001pg. Based on these results, we used the 3500 instrument—the more sensitive instrument—for the remainder of this testing.
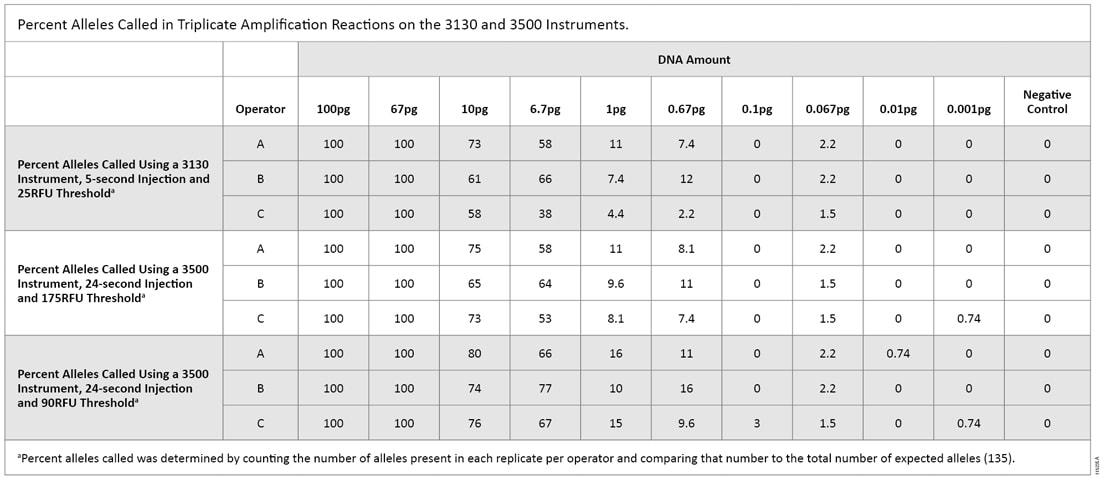 Table 2. Percent Alleles Called in Triplicate Amplification Reactions on the 3130 and 3500 Instruments.
 The second serial dilution experiment was intended to give us a practical look at what levels of DNA could pass the “DNA Free” requirements. The 3500 instrument was the only instrument used with thresholds of 90RFU and 175RFU [both 15- and 24-second injections (Table 3)]. With a 15-second injection and 90RFU threshold, a single allele (0.74%) was called at 0.01pg of DNA. That allele was not called when samples were analyzed with a 175RFU threshold. With a 24-second injection and 90RFU threshold, two replicates produced a single allele (1.5%) at 0.01pg. When samples were analyzed with a 175RFU threshold, the allele was called in only one of the replicates. Using an increased injection time (24 seconds) and the default threshold (175RFU)—the recommended test settings that will be used by a manufacturer—a single allelic peak was observed consistently at 0.1pg.
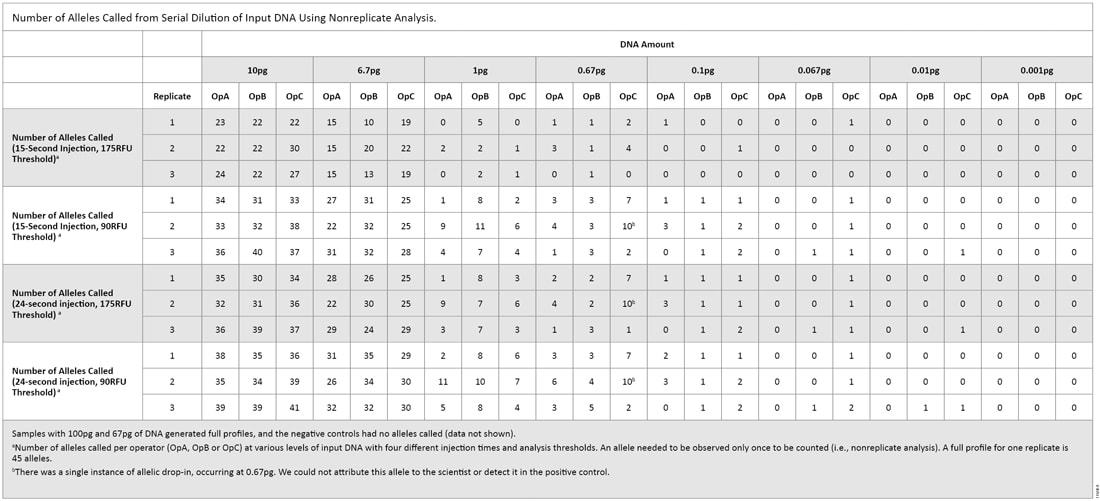 Table 3. Number of Alleles Called from Serial Dilution of Input DNA Using Nonreplicate Analysis.
 For all replicates in both experiments regardless of injection or analysis parameters, we obtained full profiles down to 67pg of DNA. For the 6.7pg samples (equivalent to one cell), up to 44% of alleles were called using the default settings for analysis (15-second injection, 175RFU threshold). In our testing of the two dilution series, we observed slightly different detection limits. A single allele was detected at 0.001pg in the first dilution series, whereas a single allele was detected at 0.01pg in the second dilution series. In both dilution series, we saw a 30–40% reduction in the number of alleles called between 6.7pg and 1.0pg, which indicates the STR system and instrument sensitivity were at or near the limit of detection (LOD). Therefore, special care should be taken when using any amplification system with low DNA amounts.
Many laboratories that perform low-copy-number (LCN) analysis do so by evaluating replicate amplification reactions. In this type of analysis, an allele is deemed a true allele only if the allele is observed in at least two of three replicates (3) . Because the PAS 377:2012 standards allow replicate analysis, we re-analyzed the data to identify alleles that were present in two of three replicate amplification reactions (5) . Due to the limited data set, we applied the “2 of 3 rule” to operators as well as replicates when determining the passing criteria (Table 4). Using this method combined with an increased injection time (24 seconds) and default analysis threshold (175RFU), the highest amount of input DNA that could be amplified and consistently pass the standard is approximately 1pg.
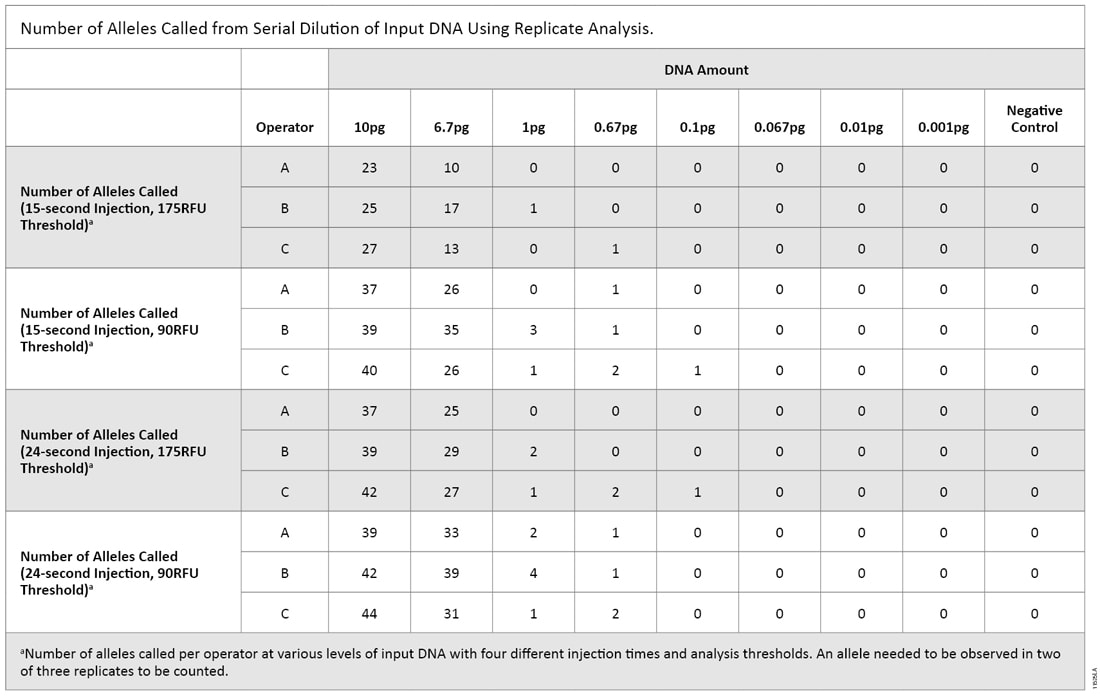 Table 4. Number of Alleles Called from Serial Dilution of Input DNA Using Replicate Analysis.
 Comparing these two serial dilution experiments makes it clear that there is a level of variability when amplifying low DNA amounts. With both replicate and nonreplicate analysis methods at varying DNA input amounts, there were instances of a single allele being called with a 175RFU threshold; this would meet the proposed UK standards. However, there were several peaks below threshold as well (Figure 2). We wonder if casework laboratories would deem these samples free of human DNA using either analysis method.
 Figure 2. Representative electropherogram with 0.67pg of input DNA.
 Amplification products were analyzed with an Applied Biosystems® 3500 Genetic Analyzer, 24-second injection and 175RFU threshold.
Determining qPCR Sensitivity by Testing with Mitochondrial DNA Primers
Comparing qPCR and STR Sensitivities when Amplifying Nuclease-Free Water
Nuclease-free water samples were tested using qPCR with mtDNA primers to determine if amounts of contaminating DNA detected by qPCR also could be detected by STR testing. Real-time qPCR systems determine how much DNA is present in a sample by measuring the level of fluorescence at each cycle. In the case of the Plexor® qPCR System, as amplification proceeds, a quenching molecule is incorporated into the PCR product and reduces fluorescence. A predetermined number of amplification cycles, in this experiment 40, are performed, and the decrease in fluorescence is measured. The decrease in fluorescence signal is inversely proportional to the amount of PCR product. The number of cycles required to reach a significant decrease in fluorescence, the quantification cycle (Cq), depends on the amount of template DNA present—the lower the DNA amount, the higher the Cq value. Conversely, the higher the DNA amount, the lower the Cq value.
All 10pg and 1pg replicate samples produced a Cq value in qPCR. Neither the 0.1pg replicates nor negative controls produced Cq values. Of the 80 samples tested, nine (11.3%) produced a Cq value (Table 5). These nine samples, as well as 33 samples with no Cq value, underwent STR amplification as described above. None of the nine samples that produced a Cq value exhibited any called alleles. Of these 42 STR reactions, one (2.4%) produced a called allelic peak. This sample did not produce a Cq value in the qPCR assay and exhibited a single allele, an 11 at D7S820, at 168RFU on the 3500 instrument (24-second injection with a 90RFU threshold). This allele did not match any alleles in the scientist’s STR profile or positive control. We were unable to determine if this allele was due to DNA in the sample or an allelic drop-in event. The positive control performed as expected, and the negative control showed no amplified product. Testing by qPCR using mtDNA primers detected <1pg of human genomic DNA more often than STR amplification (11.3% by qPCR versus 2.4% by STR analysis). This testing indicates qPCR is better at detecting low levels of human DNA than STR amplification.
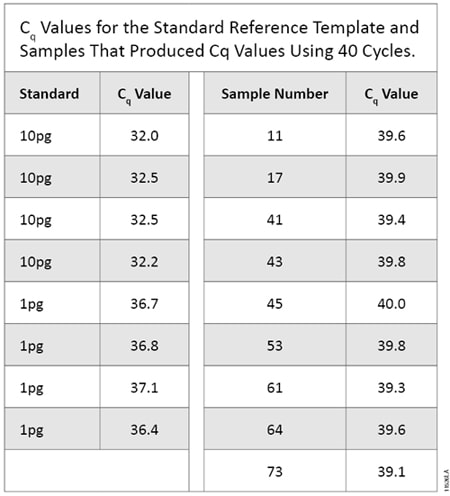 Table 5. Cq Values for the Standard Reference Template and Samples That Produced Cq Values Using 40 Cycles.
 Evaluating qPCR and STR Sensitivities Using Known Amounts of DNA
Known amounts of DNA were quantified using qPCR with mtDNA primers and amplified using STR analysis to determine which assay could detect lower levels of DNA. The cycle number was increased to 45 to facilitate detection of <1pg of DNA. Serially diluted DNA amplified by qPCR produced Cq values at all DNA concentrations down to 0.025pg (0.00667pg/µl). The 0.0025pg and 0.00025pg samples did not produce a Cq value. For the 0.025pg samples, only one of the three replicates gave a Cq value and a melting temperature (Tm) in the expected range. Therefore, we deemed this DNA amount below the limit of detection and determined the sensitivity of the qPCR assay to be 0.25pg (Table 6).
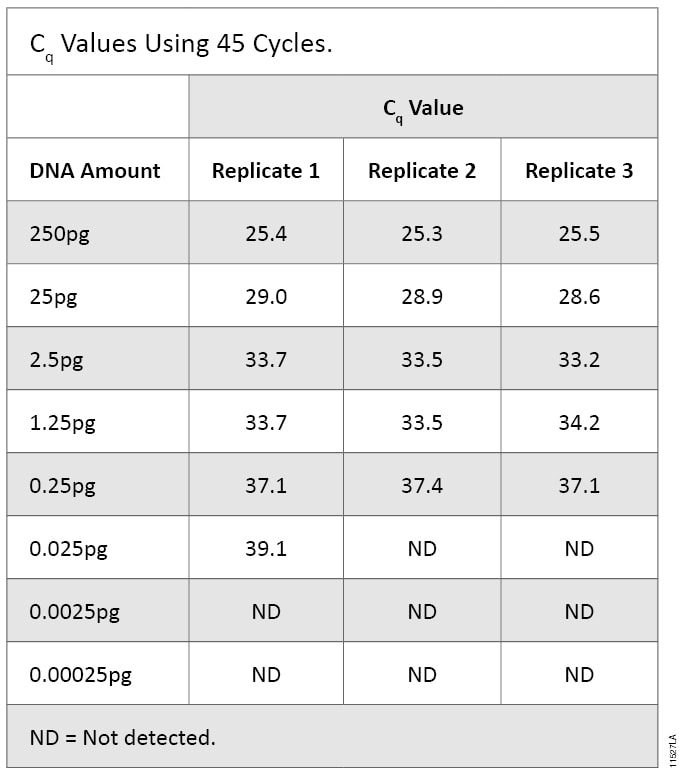 Table 6. Cq Values Using 45 Cycles.
 To allow a direct comparison of qPCR and STR methods, we used the same DNA dilution series for both assays. Because each assay allows different input volumes, the total mass of DNA was slightly different. The effective range of STR amplification was 1,000pg to 0.001pg, while the range for the qPCR assay was 250pg to 0.00025pg.
The same serially diluted DNA underwent STR amplification, and amplification products were injected on the 3500 instrument for 15 and 24 seconds and analyzed using 90RFU and 175RFU thresholds. Replicate analysis was applied to the data to determine what level of input DNA generated a reproducible single peak. Across all CE parameters, the DNA input amount that produced no more than a single replicate peak was 1pg (Table 7).
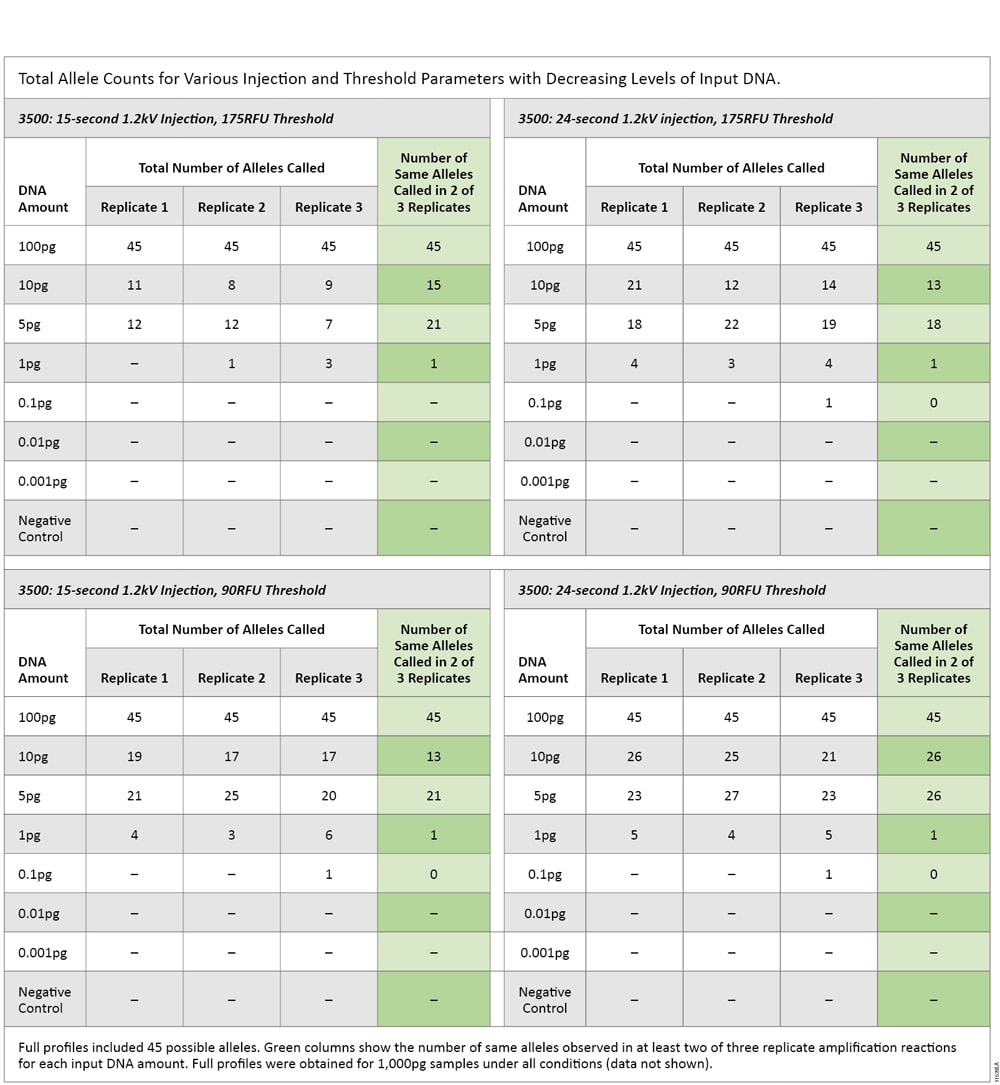 Table 7. Total Allele Counts for Various Injection and Threshold Parameters with Decreasing Levels of Input DNA.
 The sensitivity of the PowerPlex® Fusion System was consistently 1pg for LCN analysis. The sensitivity of qPCR was consistently 0.25pg. These results show that qPCR was approximately four times more sensitive than STR analysis.
Summary
We evaluated the sensitivities of current STR and qPCR assays and CE instruments in an effort to understand how Promega, as a supplier, can meet the proposed forensic standards. We sought to determine the amount of input DNA that was sufficient to produce one allelic peak and relate that to single-cell detection using current STR and CE technologies. We then compared the sensitivity of STR amplification and CE detection to the sensitivity of qPCR to determine which technology would detect low-level DNA more efficiently. Our goal was to obtain baseline data regarding detection sensitivity of low-level DNA. This information will help determine which assay system would be best suited to develop QC-testing methods that meet the proposed standards and the forensic community's requirements.
These experiments show that 6.7pg of DNA (equivalent to one cell), when amplified using current STR technology and detected using current CE instruments, resulted in STR profiles with up to 60% of expected alleles using the enhanced 3500 CE injection time (24 seconds) combined with a 175RFU threshold. The amount of DNA equivalent to “one allele peak at an increased injection setting” (24-second injection and 175RFU threshold) was 0.1pg using nonreplicate analysis and 1pg using replicate analysis; both amounts are significantly less than the amount of DNA present in one cell.
In comparing qPCR to STR analysis, we determined that qPCR testing using mitochondrial primers is at least four times more sensitive than STR testing. Logistically, qPCR is a more efficient QC-testing method than STR analysis because qPCR allows analysis of a larger sampling size. A large sample size is critical when trying to detect sporadic DNA contamination. Additionally, qPCR analysis is straightforward, objective and less prone to differences in data interpretation. STR analysis for assessing the level of DNA contamination is subjective and complex. STR analysis requires more highly trained personnel for both setup and data analysis, leading to higher costs than qPCR.
How does one prevent contaminated consumables from entering a forensic laboratory? Perhaps a method that combines prevention and detection is the answer. The AS 5483 standards recommend that a manufacturer “validate and document the use of contamination minimization measures that ensure that any human DNA in the final products is below the contamination detection limit”. The ability of these measures to prevent contamination would continue to be monitored by DNA testing. Due to the destructive nature of contamination testing via qPCR or STR amplification, 100% of plastics and reagents cannot be tested by the manufacturer. Thus, it is vital that manufacturers be allowed to determine the best means to control their processes and identify areas where contamination may occur. In conjunction with these controlled processes, appropriate sampling of consumables and testing with a sensitive assay can provide a high degree of confidence regarding the “forensic DNA grade” nature of the associated samples.
We believe that continued discussions between the forensic community, manufacturers, laboratories and policy makers about acceptable and practical steps will help ensure the quality of reagents used for forensic DNA analysis. Considerations must include the feasibility of different QC-testing methods, appropriate sampling size, impact of additional testing on a product’s price and contamination prevention through process validation. Both standards propose post-manufacture treatment of consumables (e.g., plasticware and sample-collection devices), including ethylene oxide treatment. More data need to be gathered regarding the long-term effects of ethylene oxide treatment on plastics and the residual material that treatment may leave on plastics, seals and other components used in forensic testing to ensure that there are no negative effects on product performance or downstream applications.
Manufacturers will continue to work to determine a human DNA contamination detection limit so that human DNA does not interfere with current forensic DNA analysis methods (2) . We hope laboratories will begin or continue to perform their own validation studies to determine what they believe is an acceptable detection limit as well. Allelic drop-in is not uncommon at low levels of DNA. As laboratories and manufacturers continue to push the envelope of sensitivity, allelic drop-in peaks will continue to be observed. While most forensic laboratories do not routinely perform LCN analysis, all laboratories should be aware that this phenomenon can occur and is a possible explanation when peaks are observed below the stochastic threshold. Laboratories that currently do not have a validated stochastic threshold may want to perform experiments to determine a stochastic threshold for their procedures. Even though a stochastic threshold typically defines the point at which drop-out occurs, the threshold also can be a tool to potentially account for sporadic peaks. We welcome further discussions with the community to ensure an effective and practical solution to continue to provide high-quality products to the forensic community.
Acknowledgments
We would like to thank the following people for their contributions:
Doug Storts and Andy Hopwood for guidance in experimental design.
Rohaizah James, Terri Sundquist and Susan Wigdal for their editorial contributions.
Susan Frackman and Kristina Pearson for their continued support of this project.
Article References
- The British Standards Institution and Home Office (2012) PAS 377:2012. Specification for consumables used in the collection, preservation and processing of material for forensic analysis.
- Standards Australia (2012) AS 5483 -2012. Minimizing contamination in products used to collect and analyse biological material for forensic purposes.
- Gill, P. et al. (2010) Manufacturer contamination of disposable plastic-ware and other reagents—an agreed position statement by ENFSI, SWGDAM and BSAG. Forensic Sci. Int. Genet. 4, 269–70.
- Butler, J.M. (2005) Forensic DNA typing: Biology, technology, and genetics of STR markers (2nd Edition), Elsevier Academic Press, New York..
- Gill, P. et al. (2000) An investigation of the rigor of interpretation rules for STRs derived from less than 100 pg of DNA. Forensic Sci. Int. 112, 17–40.
How to Cite This Article
Scientific Style and Format, 7th edition, 2006
Raymond, K., Setlak, J. and Stollberg, C. Examination of Proposed Manufacturing Standards Using Low Template DNA. [Internet] 2013. [cited: year, month, date]. Available from: https://www.promega.com/resources/profiles-in-dna/2013/examination-of-proposed-manufacturing-standards-using-low-template-dna/
American Medical Association, Manual of Style, 10th edition, 2007
Raymond, K., Setlak, J. and Stollberg, C. Examination of Proposed Manufacturing Standards Using Low Template DNA. Promega Corporation Web site. https://www.promega.com/resources/profiles-in-dna/2013/examination-of-proposed-manufacturing-standards-using-low-template-dna/ Updated 2013. Accessed Month Day, Year.
Contribution of an article to Profiles in DNA does not constitute an endorsement of Promega products.
Plexor and PowerPlex are registered trademarks of Promega Corporation.
Applied Biosystems, GeneAmp and GeneMapper are registered trademarks of Applied Biosystems. Hi-Di is a trademark of Applera Corporation.